Data Merging#
Enriching Table df_items#
Buyer-Seller Distance
Create a distance variable.
tmp_df_customers = df_customers.merge(df_geolocations, left_on='customer_zip_code_prefix', right_on='geolocation_zip_code_prefix', how='left')
tmp_df_customers.rename(columns={'geolocation_lat': 'lat_customer', 'geolocation_lng': 'lng_customer'}, inplace=True)
tmp_df_customers.drop(['geolocation_zip_code_prefix', 'geolocation_zip_code_prefix_3_digits'], axis=1, inplace=True)
tmp_df_sellers = df_sellers.merge(df_geolocations, left_on='seller_zip_code_prefix', right_on='geolocation_zip_code_prefix', how='left')
tmp_df_sellers.rename(columns={'geolocation_lat': 'lat_seller', 'geolocation_lng': 'lng_seller'}, inplace=True)
tmp_df_sellers.drop(['geolocation_zip_code_prefix', 'geolocation_zip_code_prefix_3_digits'], axis=1, inplace=True)
df_items = (
    df_items.merge(df_orders[['order_id', 'customer_id']], on='order_id', how='left')
    .merge(tmp_df_customers[['customer_id', 'lat_customer', 'lng_customer']], on='customer_id', how='left')
    .merge(tmp_df_sellers[['seller_id', 'lat_seller', 'lng_seller']], on='seller_id', how='left')
)
Calculate buyer-seller distances.
df_items['distance_km'] = fron.haversine_vectorized(
    df_items['lat_customer'].values,
    df_items['lng_customer'].values,
    df_items['lat_seller'].values,
    df_items['lng_seller'].values
)
df_items.drop(['customer_id', 'lat_customer', 'lng_customer', 'lat_seller', 'lng_seller'], axis=1, inplace=True)
Check for missing values.
df_items.distance_km.isna().sum()
np.int64(554)
Missing values occur when zip prefixes are absent from the geolocation table for some buyers/sellers.
The quantity is small - leave as is.
Carrier Handoff Delay
Create a carrier handoff delay variable.
df_items = df_items.merge(df_orders[['order_id', 'order_delivered_carrier_dt']], on='order_id', how='left')
df_items['carrier_delivery_delay_days'] = df_items['order_delivered_carrier_dt'] - df_items['shipping_limit_dt']
Convert to days…
df_items['carrier_delivery_delay_days'] = df_items['carrier_delivery_delay_days'].dt.total_seconds() / (24 * 3600)
df_items.drop(['order_delivered_carrier_dt'], axis=1, inplace=True)
Enriching Table df_orders#
From Table df_payments#
Create these order-level metrics:
Payment count
Payment sum
Average payment
Total installment count
Create these order-level dimensions:
Installment presence
Payment types
tmp_df_pay_agg = df_payments.copy()
tmp_df_pay_agg['has_installments'] = tmp_df_pay_agg['has_installments'] == 'Has Installments'
Examine unique payment types per order.
tmp_df_pay_agg.groupby('order_id')['payment_type'].nunique().value_counts()
payment_type
1    96851
2     2241
Name: count, dtype: int64
Since maximum is 2 payment types, concatenate them during aggregation.
tmp_df_pay_agg = (
    tmp_df_pay_agg.groupby('order_id', as_index=False)
    .agg(
        payments_cnt = ('payment_sequential', 'count')
        , total_payment = ('payment_value', 'sum')
        , avg_payment = ('payment_value', 'mean')
        , total_installments_cnt = ('payment_installments', 'sum')
        , order_has_installment = ('has_installments', 'any')
        , order_payment_types = ('payment_type', lambda x: ', '.join(sorted(set(x))))
    )
)
tmp_df_pay_agg['order_payment_types'] = tmp_df_pay_agg['order_payment_types'].astype('category')
tmp_df_pay_agg['order_has_installment'] = tmp_df_pay_agg.order_has_installment.map({True: 'Has Installments', False: 'No Installments'}).astype('category')
Merge with df_orders.
Check key mismatches.
fron.analyze_join_keys(df_orders, tmp_df_pay_agg, "order_id", how='left')
| Type | Left-only keys | Right-only keys | Left size | Right size | Left join size |
|---|---|---|---|---|---|
| 1:1 | 0 | 0 | 99,092 | 99,092 | 99,092 |
Merge tables.
df_orders = df_orders.merge(tmp_df_pay_agg, on='order_id', how='left')
From Tables df_items and df_products#
Create these order-level metrics:
Total product count
Unique product count
Seller count
Unique category count
Total product price
Average product price
Total shipping cost
Total order value
Shipping cost ratio
Order weight
Order volume
Average buyer-seller distance
Average carrier handoff delay
Create these order-level dimensions:
Free shipping indicator
Generalized product categories
First merge items and products tables.
Check key mismatches.
fron.analyze_join_keys(df_items, df_products, "product_id", how='left')
| Type | Left-only keys | Right-only keys | Left size | Right size | Left join size |
|---|---|---|---|---|---|
| N:1 | 0 | 164 | 112,279 | 32,951 | 112,279 |
Merge tables.
tmp_df_items_prods = df_items.merge(df_products, on='product_id', how='left')
Prepare dataframe.
Examine unique categories per order.
tmp_df_items_prods.groupby('order_id')['product_category'].nunique().value_counts()
product_category
1    97570
2      765
3       18
Name: count, dtype: int64
Maximum 3 categories - concatenate during aggregation.
Examine unique generalized categories per order.
tmp_df_items_prods.groupby('order_id')['general_product_category'].nunique().value_counts()
general_product_category
1    97777
2      567
3        9
Name: count, dtype: int64
Maximum 3 categories - concatenate during aggregation.
tmp_df_items_prods_agg = (tmp_df_items_prods.groupby('order_id', as_index=False)
          .agg(
              products_cnt = ('product_id', 'count')
              , unique_products_cnt = ('product_id', 'nunique')
              , sellers_cnt = ('seller_id', 'nunique')
              , product_categories_cnt = ('product_category', 'nunique')
              , total_products_price = ('price', 'sum')
              , avg_products_price = ('price', 'mean')
              , total_freight_value = ('freight_value', 'sum')
              , total_order_price = ('total_price', 'sum')
              , total_weight_kg = ('product_weight_g', 'sum')
              , total_volume_cm3 = ('product_volume_cm3', 'sum')
              , avg_distance_km = ('distance_km', 'mean')
              , avg_carrier_delivery_delay_days = ('carrier_delivery_delay_days', 'mean')
              , order_product_categories = ('product_category', lambda x: ', '.join(sorted(set(x))))
              , order_general_product_categories = ('general_product_category', lambda x: ', '.join(sorted(set(x))))
          )
)
tmp_df_items_prods_agg['freight_ratio'] = tmp_df_items_prods_agg['total_freight_value'] / tmp_df_items_prods_agg['total_order_price']
tmp_df_items_prods_agg['order_product_categories'] = tmp_df_items_prods_agg['order_product_categories'].astype('category')
tmp_df_items_prods_agg['order_general_product_categories'] = tmp_df_items_prods_agg['order_general_product_categories'].astype('category')
tmp_df_items_prods_agg['total_weight_kg'] = (tmp_df_items_prods_agg['total_weight_kg'] / 1000).round(2)
tmp_df_items_prods_agg['order_is_free_shipping'] = tmp_df_items_prods_agg.total_freight_value == 0
tmp_df_items_prods_agg['order_is_free_shipping'] = tmp_df_items_prods_agg.order_is_free_shipping.map({True: 'Free Shipping', False: 'Paid Shipping'}).astype('category')
tmp_df_items_prods_agg['order_is_free_shipping'].value_counts(dropna=False)
order_is_free_shipping
Paid Shipping    98015
Free Shipping      338
Name: count, dtype: int64
Add new fields to df_orders.
Check key mismatches.
fron.analyze_join_keys(df_orders, tmp_df_items_prods_agg, "order_id", how='left')
| Type | Left-only keys | Right-only keys | Left size | Right size | Left join size |
|---|---|---|---|---|---|
| 1:1 | 739 | 0 | 99,092 | 98,353 | 99,092 |
We previously identified orders in df_orders missing from df_items.
These are all either canceled or unavailable - missing values from items table are expected.
Merge tables.
df_orders = df_orders.merge(tmp_df_items_prods_agg, on='order_id', how='left')
From Table df_customers#
Add customer city and state.
Check key mismatches.
fron.analyze_join_keys(df_orders, df_customers, "customer_id", how='left')
| Type | Left-only keys | Right-only keys | Left size | Right size | Left join size |
|---|---|---|---|---|---|
| 1:1 | 0 | 0 | 99,092 | 99,092 | 99,092 |
Add fields to df_orders.
df_orders = df_orders.merge(df_customers[['customer_id', 'customer_unique_id', 'customer_state', 'customer_city']], on='customer_id', how='left')
From Table df_reviews#
Create these order-level metrics:
Review count
Average review score
tmp_df_reviews_agg = (
    df_reviews.groupby('order_id', as_index=False)
    .agg(
        reviews_cnt = ('review_id', 'nunique')
        , order_avg_reviews_score = ('review_score', 'mean')
    )
)
Since secondary reviews tend to be lower-scored, round down.
tmp_df_reviews_agg['order_avg_reviews_score'] = np.floor(tmp_df_reviews_agg['order_avg_reviews_score']).astype(int)
Check key mismatches.
fron.analyze_join_keys(df_orders, tmp_df_reviews_agg, "order_id", how='left')
| Type | Left-only keys | Right-only keys | Left size | Right size | Left join size |
|---|---|---|---|---|---|
| 1:1 | 0 | 0 | 99,092 | 99,092 | 99,092 |
Add fields to df_orders.
df_orders = df_orders.merge(tmp_df_reviews_agg, on='order_id', how='left')
Creating New Dimensions#
Create a new payment amount dimension
Let’s look at the quantiles in the column.
df_orders.total_payment.quantile([0.05, 0.25, 0.5, 0.75, 0.95])
0.05    32.38
0.25    62.00
0.50   105.28
0.75   176.87
0.95   452.28
Name: total_payment, dtype: float64
Create the following categories:
Cheap: ≤50 R$
Medium: 50-200 R$
Expensive: >200 R$
labels = ['Cheap', 'Medium', 'Expensive']
bins = [-np.inf, 50, 200, np.inf]
df_orders['order_total_payment_cat'] = df_orders.total_payment.preproc.to_categorical(method='custom_bins', labels=labels, bins=bins)
| Count | |
|---|---|
| Medium | 61993 |
| Expensive | 20189 |
| Cheap | 16910 |
Create a new order weight dimension
Let’s look at the quantiles in the column.
df_orders.total_weight_kg.quantile([0.05, 0.25, 0.5, 0.75, 0.95])
0.05    0.14
0.25    0.30
0.50    0.75
0.75    2.05
0.95   10.59
Name: total_weight_kg, dtype: float64
Categories for order weight:
Light: ≤500g
Medium: 500-5000g
Heavy: >5kg
labels = ['Light', 'Medium', 'Heavy']
bins = [-np.inf, 0.5, 5, np.inf]
df_orders['order_total_weight_cat'] = (
    df_orders.total_weight_kg.preproc
    .to_categorical(method='custom_bins', labels=labels, bins=bins, fill_na_value='Missing in Items')
)
| Count | |
|---|---|
| Medium | 45450 |
| Light | 39654 |
| Heavy | 13249 |
| Missing in Items | 739 |
Create a new order volume dimension
Let’s look at the quantiles in the column.
df_orders.total_volume_cm3.quantile([0.05, 0.25, 0.5, 0.75, 0.95])
0.05      816.00
0.25    2,964.00
0.50    7,260.00
0.75   19,872.00
0.95   64,000.00
Name: total_volume_cm3, dtype: float64
Categories for order volume:
Small: ≤3500 cm3
Medium: 3500-10000 cm3
Large: >10000 cm3
labels = ['Small', 'Medium', 'Large']
bins = [-np.inf, 3500, 10000, np.inf]
df_orders['order_total_volume_cat'] = (
    df_orders.total_volume_cm3.preproc
    .to_categorical(method='custom_bins', labels=labels, bins=bins, fill_na_value='Missing in Items')
)
| Count | |
|---|---|
| Large | 39869 |
| Medium | 29455 |
| Small | 29029 |
| Missing in Items | 739 |
Create a new review score dimension
Categories:
Positive: 4-5
Neutral: 3
Negative: 1-2
rules = {
    "Positive": lambda x: x.isin([4, 5]),
    "Neutral": lambda x: x == 3,
    'Negative': lambda x: x.isin([1, 2]),
    "Missing Score": "default"
}
df_orders['order_review_sentiment'] = df_orders.order_avg_reviews_score.preproc.to_categorical(rules=rules)
| Count | |
|---|---|
| Positive | 75966 |
| Negative | 14882 |
| Neutral | 8244 |
Let’s look at the missing values.
df_orders.explore.detect_anomalies()
| Count | Percent | |
|---|---|---|
| order_approved_dt | 121 | 0.12% |
| order_delivered_carrier_dt | 1714 | 1.73% |
| order_delivered_customer_dt | 2880 | 2.91% |
| from_purchase_to_approved_hours | 121 | 0.12% |
| from_purchase_to_carrier_days | 1714 | 1.73% |
| delivery_time_days | 2880 | 2.91% |
| delivery_delay_days | 2880 | 2.91% |
| from_approved_to_carrier_days | 1714 | 1.73% |
| from_carrier_to_customer_days | 2880 | 2.91% |
| delivery_time_days_cat | 2880 | 2.91% |
| products_cnt | 739 | 0.75% |
| unique_products_cnt | 739 | 0.75% |
| sellers_cnt | 739 | 0.75% |
| product_categories_cnt | 739 | 0.75% |
| total_products_price | 739 | 0.75% |
| avg_products_price | 739 | 0.75% |
| total_freight_value | 739 | 0.75% |
| total_order_price | 739 | 0.75% |
| total_weight_kg | 739 | 0.75% |
| total_volume_cm3 | 739 | 0.75% |
| avg_distance_km | 1228 | 1.24% |
| avg_carrier_delivery_delay_days | 1714 | 1.73% |
| order_product_categories | 739 | 0.75% |
| order_general_product_categories | 739 | 0.75% |
| freight_ratio | 739 | 0.75% |
| order_is_free_shipping | 739 | 0.75% |
Missing values in time-related variables occur due to absent dates (normal for undelivered orders)
Missing values in product-related variables occur because some orders aren’t in the items table (canceled/unavailable). These won’t affect sales analysis.
For dimensions, replace missing values with ‘No Order In Items’
df_orders['order_product_categories'] = df_orders['order_product_categories'].cat.add_categories('No Order in Items').fillna('No Order in Items')
df_orders['order_general_product_categories'] = df_orders['order_general_product_categories'].cat.add_categories('No Order in Items').fillna('No Order in Items')
df_orders['order_is_free_shipping'] = df_orders['order_is_free_shipping'].cat.add_categories('No Order in Items').fillna('No Order in Items')
Creating Table df_sales#
The orders table contains order creation time, payment approval time, and order status. After examining statuses:
created: Few orders, old, comments indicate non-delivery
approved: Few orders, old, no comments
processing: >90% have 1-2 star reviews, most undelivered (some reviews mention stockouts)
invoiced: >80% have 1-2 stars, mostly undelivered (some mention stockouts)
shipped: >70% have 1-2 stars, mostly undelivered
Let’s look at how the total delivery time is distributed.
df_orders.viz.histogram(
    x='delivery_time_estimated_days'
    , labels={'delivery_time_estimated_days': 'Delivery time to customer, days'}
    , title='Distribution of delivery time to customer'
)
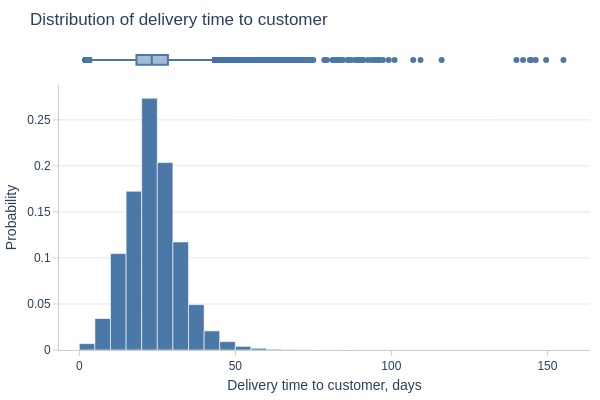
Delivery typically takes ≤1 month. We’ll use this threshold to determine delivery status.
Let’s look at how the statuses are distributed for orders that have passed a month from the estimated delivery date.
tmp_last_date = df_orders.order_purchase_dt.max()
tmp_mask = lambda x: ((tmp_last_date - x.order_estimated_delivery_dt).dt.days > 31) & (x.order_status != 'Delivered')
df_orders[tmp_mask].order_status.value_counts()
order_status
Shipped        998
Unavailable    580
Canceled       464
Processing     298
Invoiced       261
Created          5
Approved         2
Delivered        0
Name: count, dtype: int64
Key Observations:
Since delivery usually takes ≤1 month, orders exceeding this are considered undelivered (confirmed by review content mentioning non-delivery/stockouts).
We’ll define a purchase as:
Orders without ‘canceled’/‘unavailable’ status
Orders with ‘delivered’ status
Orders without ‘delivered’ status where <31 days since purchase
tmp_mask = (
    (df_orders.order_status == 'Delivered') |
    (
        ((tmp_last_date - df_orders.order_estimated_delivery_dt).dt.days <= 31) &
        (~df_orders.order_status.isin(['Canceled', 'Unavailable']))
    )
)
df_sales = df_orders[tmp_mask]
Let’s look at the count by statuses.
df_orders.order_status.value_counts()
order_status
Delivered      96211
Shipped         1097
Unavailable      602
Canceled         580
Processing       299
Invoiced         296
Created            5
Approved           2
Name: count, dtype: int64
We’ll create an order-level variable indicating purchase conversion.
df_orders['is_purchase'] = tmp_mask.map({True: 'Purchase', False: 'Not Purchase'}).astype('category')
df_orders.is_purchase.value_counts(dropna=False)
is_purchase
Purchase        96346
Not Purchase     2746
Name: count, dtype: int64
Create first purchase flag
To handle multiple purchases within the same timestamp, use ranking.
# Sort by customer and purchase date for correct ranking
df_sales = df_sales.sort_values(['customer_unique_id', 'order_purchase_dt'])

# Global first purchase flag (with tie-breaking via purchase_rank)
df_sales['customer_first_purchase_dt'] = df_sales.groupby('customer_unique_id')['order_purchase_dt'].transform('min')
df_sales['purchase_rank'] = df_sales.groupby('customer_unique_id').cumcount()
df_sales['sale_is_customer_first_purchase'] = (
    (df_sales['order_purchase_dt'] == df_sales['customer_first_purchase_dt'])
    & (df_sales['purchase_rank'] == 0)
)

df_sales.drop(columns=['purchase_rank'], inplace=True)
Let’s look at the missing values.
df_sales.explore.detect_anomalies()
| Count | Percent | |
|---|---|---|
| order_delivered_carrier_dt | 36 | 0.04% |
| order_delivered_customer_dt | 135 | 0.14% |
| from_purchase_to_carrier_days | 36 | 0.04% |
| delivery_time_days | 135 | 0.14% |
| delivery_delay_days | 135 | 0.14% |
| from_approved_to_carrier_days | 36 | 0.04% |
| from_carrier_to_customer_days | 135 | 0.14% |
| delivery_time_days_cat | 135 | 0.14% |
| avg_distance_km | 476 | 0.49% |
| avg_carrier_delivery_delay_days | 36 | 0.04% |
Results are as expected.
Enriching Table df_customers#
customer_unique_id isn’t unique in df_customers (data characteristic). For analysis, we’ll:
Save original table under new name
Remove duplicates from df_customers for user analysis
df_customers_origin = df_customers.copy()
df_customers = df_customers.drop_duplicates('customer_unique_id').drop('customer_id', axis=1)
From Table df_orders#
Create metrics for each customer:
Order count
Canceled order count
Cancelation rate
tmp_df_orders_agg = df_orders.copy()
tmp_df_orders_agg['is_canceled'] = tmp_df_orders_agg['order_status'] == 'Canceled'
tmp_df_orders_agg['is_not_delivered'] = tmp_df_orders_agg['order_status'] != 'Delivered'
tmp_df_orders_agg['is_customer_issue'] = tmp_df_orders_agg['delivery_issue_reason'] == 'Customer Issue'
tmp_df_orders_agg['is_service_issue'] = tmp_df_orders_agg['delivery_issue_reason'] == 'Service Issue'
tmp_df_orders_agg = (
    tmp_df_orders_agg.groupby('customer_unique_id', as_index=False)
    .agg(
        orders_cnt = ('order_id', 'nunique')
        , canceled_share = ('is_canceled', 'mean')
        , canceled_orders_cnt= ('is_canceled', 'sum')
        , not_delivered_share = ('is_not_delivered', 'mean')
        , customer_issue_share = ('is_customer_issue', 'mean')
        , service_issue_share = ('is_service_issue', 'mean')
    )
)
Check key mismatches.
fron.analyze_join_keys(df_orders, tmp_df_reviews_agg, "order_id", how='left')
| Type | Left-only keys | Right-only keys | Left size | Right size | Left join size |
|---|---|---|---|---|---|
| 1:1 | 0 | 0 | 99,092 | 99,092 | 99,092 |
Merge tables.
df_customers = df_customers.merge(tmp_df_orders_agg, on='customer_unique_id', how='left')
From Table df_sales#
Create metrics for each customer:
Purchase count
Average delivery time
Average delivery delay
Delayed order rate
Weekend purchase rate
Average inter-purchase time
Average payment count
Total payments
Average order value
Average single payment amount
Installment order rate
Average product count per order
Average unique product count
Average seller count per order
Total product value
Average product value
Average single product value
Average shipping cost
Average order weight
Average order volume
Free shipping rate
Review count
Average review score
Active months count
Max consecutive active months
Create dimensions for each customer:
Installment usage
Payment types
Top 3 purchase weekdays
Top 3 product categories
Top 3 generalized categories
First purchase date
Top 3 Weekdays
df_sales.groupby('customer_unique_id')['purchase_weekday'].nunique().value_counts()
purchase_weekday
1    91518
2     1619
3       76
4       17
5        5
Name: count, dtype: int64
Aggregate top 3 weekdays by purchase frequency.
top_purchase_weekdays = (
    df_sales.groupby(['customer_unique_id', 'purchase_weekday'], as_index=False, observed=True)
    .size()
    .sort_values(by=['customer_unique_id', 'size'], ascending=[True, False])
    .groupby('customer_unique_id')
    .head(3)
)
top_purchase_weekdays = (
    top_purchase_weekdays.groupby('customer_unique_id', as_index=False)
    .agg(
        customer_top_purchase_weekdays = ('purchase_weekday', lambda x: ', '.join(sorted(set(x))))
    )
)
Top 3 Payment Types:
payment_types = (
    df_sales.merge(df_payments, on='order_id', how='left')
)
payment_types.groupby('customer_unique_id')['payment_type'].nunique().value_counts()
payment_type
1    90805
2     2417
3       13
Name: count, dtype: int64
Concatenate into string.
payment_types = (
    payment_types.groupby('customer_unique_id', as_index=False)
    .agg(
        customer_payment_types = ('payment_type', lambda x: ', '.join(sorted(set(x))))
    )
)
Top 3 Product Categories:
top_product_categories = (
    df_sales.merge(df_items, on='order_id', how='left')
    .merge(df_products, on='product_id', how='left')
)
(top_product_categories.drop_duplicates(['customer_unique_id', 'order_id', 'product_category'])
.groupby(['customer_unique_id'])['product_category']
.nunique()
.value_counts()
)
product_category
1    90973
2     2125
3      118
4       13
5        6
Name: count, dtype: int64
Aggregate top 3 categories by frequency.
top_product_categories = (
    top_product_categories.drop_duplicates(['customer_unique_id', 'order_id', 'product_category'])
    .groupby(['customer_unique_id', 'product_category'], as_index=False, observed=True)
    .size()
    .sort_values(by=['customer_unique_id', 'size'], ascending=[True, False])
    .groupby('customer_unique_id')
    .head(3)
)
top_product_categories = (
    top_product_categories.groupby('customer_unique_id', as_index=False)
    .agg(
        customer_top_product_categories = ('product_category', lambda x: ', '.join(sorted(set(x))))
    )
)
Top 3 Generalized Categories
top_general_product_categories = (
    df_sales.merge(df_items, on='order_id', how='left')
    .merge(df_products, on='product_id', how='left')
)
(top_general_product_categories.drop_duplicates(['customer_unique_id', 'order_id', 'general_product_category'])
.groupby(['customer_unique_id'])['general_product_category']
.nunique()
.value_counts()
)
general_product_category
1    91416
2     1737
3       72
4        9
5        1
Name: count, dtype: int64
Aggregate top 3 categories by frequency.
top_general_product_categories = (
    top_general_product_categories.drop_duplicates(['customer_unique_id', 'order_id', 'general_product_category'])
    .groupby(['customer_unique_id', 'general_product_category'], as_index=False, observed=True)
    .size()
    .sort_values(by=['customer_unique_id', 'size'], ascending=[True, False])
    .groupby('customer_unique_id')
    .head(3)
)
top_general_product_categories = (
    top_general_product_categories.groupby('customer_unique_id', as_index=False)
    .agg(
        customer_top_general_product_categories = ('general_product_category', lambda x: ', '.join(sorted(set(x))))
    )
)
tmp_df_sales_agg = df_sales.copy()
tmp_df_sales_agg['is_delayed'] = tmp_df_sales_agg['is_delayed'] == 'Delayed'
tmp_df_sales_agg['is_purchase_weekend'] = tmp_df_sales_agg['purchase_day_type'] == 'Weekend'
tmp_df_sales_agg['order_has_installment'] = tmp_df_sales_agg['order_has_installment'] == 'Has Installments'
tmp_df_sales_agg['order_is_free_shipping'] = tmp_df_sales_agg['order_is_free_shipping'] == 'Free Shipping'
tmp_df_sales_agg = (
    tmp_df_sales_agg.groupby('customer_unique_id', as_index=False)
    .agg(
        buys_cnt = ('order_id', 'nunique')
        , avg_delivery_time_days = ('delivery_time_days', 'mean')
        , avg_delivery_delay_days = ('delivery_delay_days', 'mean')
        , delayed_orders_share = ('is_delayed', 'mean')
        , purchase_weekend_share = ('is_purchase_weekend', 'mean')
        , repeat_purchase_share = ('sale_is_customer_first_purchase', 'mean')
        , avg_payments_cnt = ('payments_cnt', 'mean')
        , total_customer_payment = ('total_payment', 'sum')
        , avg_total_order_payment = ('total_payment', 'mean')
        , avg_individual_payment = ('avg_payment', 'mean')
        , installment_orders_share = ('order_has_installment', 'mean')
        , avg_products_cnt = ('products_cnt', 'mean')
        , avg_unique_products_cnt = ('unique_products_cnt', 'mean')
        , avg_sellers_cnt = ('sellers_cnt', 'mean')
        , avg_order_total_products_price = ('total_products_price', 'mean')
        , avg_total_order_price = ('total_order_price', 'mean')
        , avg_products_price = ('avg_products_price', 'mean')
        , total_products_price = ('total_products_price', 'sum')
        , avg_order_total_freight_value = ('total_freight_value', 'mean')
        , avg_order_total_weight_kg = ('total_weight_kg', 'mean')
        , avg_order_total_volume_cm3 = ('total_volume_cm3', 'mean')
        , free_shipping_share = ('order_is_free_shipping', 'mean')
        , reviews_cnt = ('reviews_cnt', 'sum')
        , customer_avg_reviews_score = ('order_avg_reviews_score', 'mean')
        , avg_distance_km = ('avg_distance_km', 'mean')
        , first_purchase_dt = ('order_purchase_dt', 'min')
        , last_purchase_dt=('order_purchase_dt', 'max')
        , from_first_to_second_days=('order_purchase_dt', lambda x: (x.nsmallest(2).iloc[-1] - x.min()).total_seconds() / (3600*24) if len(x) > 1 else np.nan)
        , from_first_to_last_days=('order_purchase_dt', lambda x: (x.max() - x.min()).total_seconds() / (3600*24) if len(x) > 1 else np.nan)
    )
    .merge(top_purchase_weekdays, on='customer_unique_id', how='left')
    .merge(payment_types, on='customer_unique_id', how='left')
    .merge(top_product_categories, on='customer_unique_id', how='left')
    .merge(top_general_product_categories, on='customer_unique_id', how='left')

)
We calculated the average value of the column ‘sale_is_customer_first_purchase’, but to get the proportion of repeat purchases, we need to subtract this value from 1.
tmp_df_sales_agg['repeat_purchase_share'] = 1 - tmp_df_sales_agg['repeat_purchase_share']
Missing values in dimensions for customers without df_items orders will show ‘No Order In Items’.
tmp_df_sales_agg['customer_top_product_categories'] = tmp_df_sales_agg['customer_top_product_categories'].fillna('No Order in Items')
tmp_df_sales_agg['customer_top_general_product_categories'] = tmp_df_sales_agg['customer_top_general_product_categories'].fillna('No Order in Items')
tmp_df_sales_agg['customer_top_purchase_weekdays'] = tmp_df_sales_agg['customer_top_purchase_weekdays'].astype('category')
tmp_df_sales_agg['customer_payment_types'] = tmp_df_sales_agg['customer_payment_types'].astype('category')
tmp_df_sales_agg['customer_top_product_categories'] = tmp_df_sales_agg['customer_top_product_categories'].astype('category')
tmp_df_sales_agg['customer_top_general_product_categories'] = tmp_df_sales_agg['customer_top_general_product_categories'].astype('category')
Inter-purchase Time
tmp_df_diff_days = (df_sales[['customer_unique_id', 'order_purchase_dt']]
          .sort_values(['customer_unique_id', 'order_purchase_dt'])
)
tmp_df_diff_days['avg_buys_diff_days'] = (tmp_df_diff_days.groupby(['customer_unique_id'])['order_purchase_dt']
                  .diff()
                  .apply(lambda x: x.days + x.seconds / (24 * 3600))
)
tmp_df_diff_days.dropna(subset='avg_buys_diff_days', inplace=True)
tmp_df_diff_days = (tmp_df_diff_days.groupby('customer_unique_id', as_index=False)
               .agg(avg_buys_diff_days = ('avg_buys_diff_days', 'mean')
               )
)
Check key mismatches.
fron.analyze_join_keys(tmp_df_sales_agg, tmp_df_diff_days, "customer_unique_id", how='left')
| Type | Left-only keys | Right-only keys | Left size | Right size | Left join size |
|---|---|---|---|---|---|
| 1:1 | 90,443 | 0 | 93,235 | 2,792 | 93,235 |
NA for single-purchase customers (expected).
Merge tables.
tmp_df_sales_agg = tmp_df_sales_agg.merge(tmp_df_diff_days, on='customer_unique_id', how='left')
Active Months
tmp_df_months_with_buys = (
    df_sales.assign(
        year_month = lambda x: x.order_purchase_dt.dt.to_period('M')
    )
    .groupby('customer_unique_id', as_index=False)
    .agg(months_with_buys = ('year_month', 'nunique'))
)
tmp_df_months_with_buys.months_with_buys.value_counts(dropna=False)
months_with_buys
1    91550
2     1576
3       87
4       17
6        3
5        1
9        1
Name: count, dtype: int64
Check key mismatches.
fron.analyze_join_keys(tmp_df_sales_agg, tmp_df_months_with_buys, "customer_unique_id", how='left')
| Type | Left-only keys | Right-only keys | Left size | Right size | Left join size |
|---|---|---|---|---|---|
| 1:1 | 0 | 0 | 93,235 | 93,235 | 93,235 |
Merge tables.
tmp_df_sales_agg = tmp_df_sales_agg.merge(tmp_df_months_with_buys, on='customer_unique_id', how='left')
Consecutive Active Months
Count streaks of ≥2 months.
tmp_df_max_months_with_buys = df_sales[['order_purchase_dt', 'customer_unique_id', 'order_id']]
tmp_df_max_months_with_buys['year_month'] = tmp_df_max_months_with_buys.order_purchase_dt.dt.to_period('M')
tmp_df_max_months_with_buys = tmp_df_max_months_with_buys.drop_duplicates(['customer_unique_id', 'year_month'])
tmp_df_max_months_with_buys = tmp_df_max_months_with_buys.sort_values(['customer_unique_id', 'year_month'])
tmp_df_max_months_with_buys['diff'] = tmp_df_max_months_with_buys.groupby('customer_unique_id')['year_month'].diff()
tmp_df_max_months_with_buys.dropna(subset='diff', inplace=True)
tmp_df_max_months_with_buys.fillna(0, inplace=True)
tmp_df_max_months_with_buys['is_diff_one_month'] = tmp_df_max_months_with_buys['diff'] == pd.offsets.MonthEnd(1)
def get_max_consecutive_repeats_plus_on(x):
    res = x.ne(x.shift()).cumsum()[x].value_counts().max() + 1
    return res
tmp_df_max_months_with_buys = (
    tmp_df_max_months_with_buys.groupby('customer_unique_id')
    .agg(max_consecutive_months_with_buys = ('is_diff_one_month', get_max_consecutive_repeats_plus_on))
    .dropna()
    .astype(int)
    .reset_index()
)
Check key mismatches.
fron.analyze_join_keys(tmp_df_sales_agg, tmp_df_max_months_with_buys, "customer_unique_id", how='left')
| Type | Left-only keys | Right-only keys | Left size | Right size | Left join size |
|---|---|---|---|---|---|
| 1:1 | 92,786 | 0 | 93,235 | 449 | 93,235 |
We have many users who made purchases in only one month, so they have a missing value in the new field. We will replace it with 1 after merging.
Merge tables.
tmp_df_sales_agg = tmp_df_sales_agg.merge(tmp_df_max_months_with_buys, on='customer_unique_id', how='left')
Replace NA with 1.
tmp_df_sales_agg.max_consecutive_months_with_buys = tmp_df_sales_agg.max_consecutive_months_with_buys.fillna(1).astype(int)
tmp_df_sales_agg.max_consecutive_months_with_buys.value_counts(dropna=False)
max_consecutive_months_with_buys
1    92786
2      438
3        8
4        1
5        1
6        1
Name: count, dtype: int64
Merge with df_customers
Check key mismatches.
fron.analyze_join_keys(df_customers, tmp_df_sales_agg, "customer_unique_id", how='left')
| Type | Left-only keys | Right-only keys | Left size | Right size | Left join size |
|---|---|---|---|---|---|
| 1:1 | 2,539 | 0 | 95,774 | 93,235 | 95,774 |
Missing values occur for customers with only canceled orders.
Merge tables.
df_customers = df_customers.merge(tmp_df_sales_agg, on='customer_unique_id', how='left')
From Table df_geolocations#
Check key mismatches.
fron.analyze_join_keys(df_customers, df_geolocations, left_on='customer_zip_code_prefix', right_on='geolocation_zip_code_prefix', how='left')
| Type | Left-only keys | Right-only keys | Left size | Right size | Left join size |
|---|---|---|---|---|---|
| N:1 | 156 | 4,193 | 95,774 | 19,015 | 95,774 |
As we already found out, there are customers whose prefixes are not present in the geolocation table.
We need full prefixes only to calculate the distance between the customer and the seller.
For geo-analysis, we will use the truncated prefixes. Let’s check if there are any missing rows.
fron.analyze_join_keys(df_customers, df_geolocations, left_on='customer_zip_code_prefix_3_digits', right_on='geolocation_zip_code_prefix_3_digits', how='left')
| Type | Left-only keys | Right-only keys | Left size | Right size | Left join size |
|---|---|---|---|---|---|
| N:M | 0 | 5 | 95,774 | 19,015 | 3,109,891 |
With geo-analysis, there will be no problems. The issue is only with calculating the distance.
We can try to fill in the coordinates based on the truncated prefixes and calculate the coordinates.
However, this will clearly result in significant error, and we want to preserve accuracy.
If we fill in these missing values, we will introduce more distortion into the data than gain any benefit.
Given that there are few missing rows, we will simply leave them as is and analyze the distance without them.
Merge tables.
df_customers = df_customers.merge(df_geolocations, left_on='customer_zip_code_prefix', right_on='geolocation_zip_code_prefix', how='left')
df_customers.rename(columns={'geolocation_lat': 'lat_customer', 'geolocation_lng': 'lng_customer'}, inplace=True)
df_customers.drop(['geolocation_zip_code_prefix', 'geolocation_zip_code_prefix_3_digits'], axis=1, inplace=True)
Let’s look at the missing values.
df_customers.explore.detect_anomalies()
| Count | Percent | |
|---|---|---|
| buys_cnt | 2539 | 2.65% |
| avg_delivery_time_days | 2670 | 2.79% |
| avg_delivery_delay_days | 2670 | 2.79% |
| delayed_orders_share | 2539 | 2.65% |
| purchase_weekend_share | 2539 | 2.65% |
| repeat_purchase_share | 2539 | 2.65% |
| avg_payments_cnt | 2539 | 2.65% |
| total_customer_payment | 2539 | 2.65% |
| avg_total_order_payment | 2539 | 2.65% |
| avg_individual_payment | 2539 | 2.65% |
| installment_orders_share | 2539 | 2.65% |
| avg_products_cnt | 2539 | 2.65% |
| avg_unique_products_cnt | 2539 | 2.65% |
| avg_sellers_cnt | 2539 | 2.65% |
| avg_order_total_products_price | 2539 | 2.65% |
| avg_total_order_price | 2539 | 2.65% |
| avg_products_price | 2539 | 2.65% |
| total_products_price | 2539 | 2.65% |
| avg_order_total_freight_value | 2539 | 2.65% |
| avg_order_total_weight_kg | 2539 | 2.65% |
| avg_order_total_volume_cm3 | 2539 | 2.65% |
| free_shipping_share | 2539 | 2.65% |
| reviews_cnt | 2539 | 2.65% |
| customer_avg_reviews_score | 2539 | 2.65% |
| avg_distance_km | 2992 | 3.12% |
| first_purchase_dt | 2539 | 2.65% |
| last_purchase_dt | 2539 | 2.65% |
| from_first_to_second_days | 92982 | 97.08% |
| from_first_to_last_days | 92982 | 97.08% |
| customer_top_purchase_weekdays | 2539 | 2.65% |
| customer_payment_types | 2539 | 2.65% |
| customer_top_product_categories | 2539 | 2.65% |
| customer_top_general_product_categories | 2539 | 2.65% |
| avg_buys_diff_days | 92982 | 97.08% |
| months_with_buys | 2539 | 2.65% |
| max_consecutive_months_with_buys | 2539 | 2.65% |
| lat_customer | 268 | 0.28% |
| lng_customer | 268 | 0.28% |
| in_south_america | 268 | 0.28% |
All missing values are expected.
Missing values are for customers who did not make any successful purchases.
We will replace the missing values in the measurements with ‘Never Converted’.
df_customers['customer_top_purchase_weekdays'] = (
    df_customers['customer_top_purchase_weekdays']
    .cat.add_categories('Never Converted')
    .fillna('Never Converted')
)
df_customers['customer_payment_types'] = (
    df_customers['customer_payment_types']
    .cat.add_categories('Never Converted')
    .fillna('Never Converted')
)
df_customers['customer_top_product_categories'] = (
    df_customers['customer_top_product_categories']
    .cat.add_categories('Never Converted')
    .fillna('Never Converted')
)
df_customers['customer_top_general_product_categories'] = (
    df_customers['customer_top_general_product_categories']
    .cat.add_categories('Never Converted')
    .fillna('Never Converted')
)
Customer Segmentation#
Based on customer metrics, we will segment the customers.
**Monetary Value **
Examine quantiles in the total_customer_payment column.
df_customers.total_customer_payment.quantile([0, 0.05, 0.25, 0.5, 0.75, 0.95, 1])
0.00        9.59
0.05       32.69
0.25       63.06
0.50      107.78
0.75      182.46
0.95      469.33
1.00   13,664.08
Name: total_customer_payment, dtype: float64
We create the following segments:
Low value: payments up to 63 R$ inclusive
Medium value: payments from 63 to 182 R$ inclusive
High value: payments above 182 R$
labels = ['Low', 'Medium', 'High']
bins = [-np.inf, 63, 182, np.inf]
df_customers['value_segment'] = (
    df_customers.total_customer_payment.preproc
    .to_categorical(method='custom_bins', labels=labels, bins=bins, fill_na_value='Never Converted')
)
| Count | |
|---|---|
| Medium | 46579 |
| High | 23370 |
| Low | 23286 |
| Never Converted | 2539 |
Activity
We identify the following segments:
Non-converted: customers who didn’t complete any successful purchases
Core customers:
Completed 3 or more purchases
Time between first and last purchase is 60 days or more
Potential core:
Completed 2 or more purchases
Time between first and last purchase is 30 days or less
Short-term repeaters:
Completed more than 2 purchases
Time between first and last purchase is less than 30 days
One-time buyers: completed only one purchase
now = df_sales.order_purchase_dt.max()
conditions = [
    df_customers['first_purchase_dt'].isna() # No Successful Purchases
    , (df_customers['buys_cnt'] >= 3) & (df_customers['from_first_to_last_days'] >= 60) # Core
    , (df_customers['buys_cnt'] >= 2) & (df_customers['from_first_to_last_days'] >= 30) # Potential Core
    , (df_customers['buys_cnt'] >= 2) & (df_customers['from_first_to_last_days'] < 30) # Short-Lived Repeat
    , (df_customers['buys_cnt'] == 1) # One-Time
]
choices = ['Never Converted', 'Core', 'Potential Core', 'Short-Lived Repeat', 'One Time']
df_customers['activity_segment'] = np.select(conditions, choices, default='Other')
df_customers['activity_segment'] = df_customers['activity_segment'].astype('category')
df_customers['activity_segment'].value_counts(dropna=False)
activity_segment
One Time              90443
Never Converted        2539
Short-Lived Repeat     1341
Potential Core         1293
Core                    158
Name: count, dtype: int64
Examine quantiles in the avg_buys_diff_days column.
df_customers.avg_buys_diff_days.quantile([0, 0.05, 0.25, 0.5, 0.75, 0.95, 1])
0.00     0.00
0.05     0.00
0.25     0.01
0.50    32.60
0.75   124.55
0.95   311.36
1.00   582.86
Name: avg_buys_diff_days, dtype: float64
We create the following segments:
Weekly
Monthly
Quarterly
Semiannual
Annual
labels = ['Weekly', 'Monthly', 'Quarterly', 'Semiannual', 'Annual']
bins = [-np.inf, 7, 30, 90, 180, np.inf]
df_customers['purchase_freq_segment'] = (
    df_customers.avg_buys_diff_days.preproc
    .to_categorical(method='custom_bins', labels=labels, bins=bins)
)
| Count | |
|---|---|
| NaN | 92982 |
| Weekly | 971 |
| Quarterly | 534 |
| Annual | 460 |
| Semiannual | 431 |
| Monthly | 396 |
Missing values require two-step replacement as they occur for both non-converted customers and those without any purchases.
mask_one_time = df_customers['buys_cnt'] == 1
mask_never_converted = df_customers['buys_cnt'].isna()

df_customers['purchase_freq_segment'] = (
    df_customers['purchase_freq_segment'].cat.add_categories(['Non-Repeating', 'Never Converted'])
)

df_customers.loc[mask_one_time, 'purchase_freq_segment'] = 'Non-Repeating'
df_customers.loc[mask_never_converted, 'purchase_freq_segment'] = 'Never Converted'
df_customers['purchase_freq_segment'].value_counts()
purchase_freq_segment
Non-Repeating      90443
Never Converted     2539
Weekly               971
Quarterly            534
Annual               460
Semiannual           431
Monthly              396
Name: count, dtype: int64
Examine quantiles in the from_first_to_second_days column.
df_customers.from_first_to_second_days.quantile([0, 0.05, 0.25, 0.5, 0.75, 0.95, 1])
0.00     0.00
0.05     0.00
0.25     0.00
0.50    28.91
0.75   125.49
0.95   318.98
1.00   582.86
Name: from_first_to_second_days, dtype: float64
We create the following segments:
Fast repeaters: repurchase within 14 days
Medium repeaters: repurchase in 14-60 days
Slow repeaters: repurchase after 60 days
labels = ['Fast Repeat', 'Medium Repeat', 'Slow Repeat']
bins = [-np.inf, 14, 60, np.inf]
df_customers['repeat_segment'] = (
    df_customers.from_first_to_second_days.preproc
    .to_categorical(method='custom_bins', labels=labels, bins=bins)
)
| Count | |
|---|---|
| NaN | 92982 |
| Fast Repeat | 1169 |
| Slow Repeat | 1087 |
| Medium Repeat | 536 |
We replace missing values.
df_customers['repeat_segment'] = (
    df_customers['repeat_segment'].cat.add_categories(['Non-Repeating', 'Never Converted'])
)

df_customers.loc[mask_one_time, 'repeat_segment'] = 'Non-Repeating'
df_customers.loc[mask_never_converted, 'repeat_segment'] = 'Never Converted'
df_customers['repeat_segment'].value_counts()
repeat_segment
Non-Repeating      90443
Never Converted     2539
Fast Repeat         1169
Slow Repeat         1087
Medium Repeat        536
Name: count, dtype: int64
Loyalty
Examine quantiles in the customer_avg_reviews_score column.
df_customers.customer_avg_reviews_score.quantile([0, 0.05, 0.25, 0.5, 0.75, 0.95, 1])
0.00   1.00
0.05   1.00
0.25   4.00
0.50   5.00
0.75   5.00
0.95   5.00
1.00   5.00
Name: customer_avg_reviews_score, dtype: float64
We create the following segments:
Critics: average score below 3
Neutral: average score 3-4
Promoters: average score 5
labels = ['Critic', 'Neutral', 'Promoter']
bins = [-np.inf, 3, 5, np.inf]
df_customers['loyalty_segment'] = (
    df_customers.customer_avg_reviews_score.preproc
    .to_categorical(method='custom_bins', labels=labels, bins=bins, fill_na_value='Never Converted', right=False)
)
| Count | |
|---|---|
| Promoter | 54386 |
| Neutral | 26534 |
| Critic | 12315 |
| Never Converted | 2539 |
Risk Segment
Examine quantiles in the canceled_share column.
df_customers.canceled_share.quantile([0, 0.05, 0.25, 0.5, 0.75, 0.95, 1])
0.00   0.00
0.05   0.00
0.25   0.00
0.50   0.00
0.75   0.00
0.95   0.00
1.00   1.00
Name: canceled_share, dtype: float64
We create the following segments:
Reliable: 0% cancellation rate
Risky: cancellation rate above 0%
labels = ['Reliable', 'Risky']
bins = [-np.inf, 0, np.inf]
df_customers['risk_segment'] = (
    df_customers.canceled_share.preproc
    .to_categorical(method='custom_bins', labels=labels, bins=bins)
)
| Count | |
|---|---|
| Reliable | 95197 |
| Risky | 577 |
Customer Behavioral Characteristics
Examine quantiles in the purchase_weekend_share column.
df_customers.purchase_weekend_share.quantile([0, 0.05, 0.25, 0.5, 0.75, 0.95, 1])
0.00   0.00
0.05   0.00
0.25   0.00
0.50   0.00
0.75   0.00
0.95   1.00
1.00   1.00
Name: purchase_weekend_share, dtype: float64
We create the following segments:
Weekday buyers: 0% weekend purchases
Weekend buyers: weekend purchases above 0%
labels = ['Weekday', 'Weekend']
bins = [-np.inf, 0, np.inf]
df_customers['weekday_segment'] = (
    df_customers.purchase_weekend_share.preproc
    .to_categorical(method='custom_bins', labels=labels, bins=bins, fill_na_value='Never Converted')
)
| Count | |
|---|---|
| Weekday | 71456 |
| Weekend | 21779 |
| Never Converted | 2539 |
Examine quantiles in the installment_orders_share column.
df_customers.installment_orders_share.quantile([0, 0.05, 0.25, 0.5, 0.75, 0.95, 1])
0.00   0.00
0.05   0.00
0.25   0.00
0.50   1.00
0.75   1.00
0.95   1.00
1.00   1.00
Name: installment_orders_share, dtype: float64
We create the following segments:
Full payment: 0% installment orders
Installment users: installment orders above 0%
labels = ['Full Pay', 'Installment']
bins = [-np.inf, 0, np.inf]
df_customers['installment_segment'] = (
    df_customers.installment_orders_share.preproc
    .to_categorical(method='custom_bins', labels=labels, bins=bins, fill_na_value='Never Converted')
)
| Count | |
|---|---|
| Installment | 48124 |
| Full Pay | 45111 |
| Never Converted | 2539 |
Order Characteristics
Examine quantiles in the avg_products_cnt column.
df_customers.avg_products_cnt.quantile([0, 0.05, 0.25, 0.5, 0.75, 0.95, 1])
0.00    1.00
0.05    1.00
0.25    1.00
0.50    1.00
0.75    1.00
0.95    2.00
1.00   21.00
Name: avg_products_cnt, dtype: float64
We create the following segments:
Single product buyers: average 1 product per order
Multi-product buyers: average 1-2 products per order
Bulk buyers: average more than 2 products per order
labels = ['Single Product', 'Multi Product', 'Bulk Buyer']
bins = [-np.inf, 1, 2, np.inf]
df_customers['products_cnt_segment'] = (
    df_customers.avg_products_cnt.preproc
    .to_categorical(method='custom_bins', labels=labels, bins=bins, fill_na_value='Never Converted')
)
| Count | |
|---|---|
| Single Product | 83774 |
| Multi Product | 7372 |
| Never Converted | 2539 |
| Bulk Buyer | 2089 |
Examine quantiles in the avg_order_total_weight_kg column.
df_customers.avg_order_total_weight_kg.quantile([0, 0.05, 0.25, 0.5, 0.75, 0.95, 1])
0.00     0.00
0.05     0.15
0.25     0.30
0.50     0.75
0.75     2.10
0.95    10.48
1.00   184.40
Name: avg_order_total_weight_kg, dtype: float64
We create the following segments:
Light orders: average up to 0.5 kg
Medium orders: average 0.5-2.5 kg
Heavy orders: average more than 2.5 kg
labels = ['Light', 'Medium', 'Heavy']
bins = [-np.inf, 0.5, 2.5, np.inf]
df_customers['weight_segment'] = (
    df_customers.avg_order_total_weight_kg.preproc
    .to_categorical(method='custom_bins', labels=labels, bins=bins, fill_na_value='Never Converted')
)
| Count | |
|---|---|
| Light | 37333 |
| Medium | 35503 |
| Heavy | 20399 |
| Never Converted | 2539 |
Enriching Table df_products#
From Table df_orders#
We will create the following metrics for each product:
Count of canceled orders containing this product
tmp_df_products_canceled = (
    df_orders[lambda x: x.order_status == 'Canceled'][['order_id']]
    .merge(df_items, on='order_id', how='left')
    .groupby('product_id', as_index=False)
    .agg(
        product_canceled_orders_cnt = ('order_id', 'nunique')
    )
)
We will merge this with the main products dataframe.
Check key mismatches.
fron.analyze_join_keys(df_products, tmp_df_products_canceled, "product_id", how='left')
| Type | Left-only keys | Right-only keys | Left size | Right size | Left join size |
|---|---|---|---|---|---|
| 1:1 | 32,528 | 0 | 32,951 | 423 | 32,951 |
Missing values will appear for products that were not part of canceled orders.
Merge tables.
df_products = df_products.merge(tmp_df_products_canceled, on='product_id', how='left')
From Table df_sales#
We will create the following additional metrics for each product:
Count of orders containing this product
Total units sold of this product
Total sales value for this product
Average quantity of this product per order
Average share of this product in order by quantity
Average share of this product in order by value
Average price of product over all time
Maximum price of product
Minimum price of product
Price range
tmp_df_products = (
    df_sales[['order_id']].merge(df_items, on='order_id', how='left')
    .groupby('product_id', as_index=False)
    .agg(
        product_sales_cnt = ('order_id', 'nunique')
        , total_units_sold = ('order_item_id', 'count')
        , total_sales_amount = ('price', 'sum')
        , avg_price = ('price', 'mean')
        , min_price = ('price', 'min')
        , max_price = ('price', 'max')
    )
)
tmp_df_products['price_range'] = tmp_df_products['max_price'] - tmp_df_products['min_price']
We will calculate average shares in orders.
tmp_df_products_share = (df_sales[['order_id']].merge(df_items, on='order_id', how='left')
                      .groupby(['order_id', 'product_id'], as_index=False)
                      .agg(
                          product_qty = ('order_item_id', 'count')
                          , product_total_price = ('price', 'sum')
                      )
)
tmp_df_products_share['products_cnt'] = tmp_df_products_share.groupby('order_id').product_qty.transform('sum')
tmp_df_products_share['order_total_price'] = tmp_df_products_share.groupby('order_id').product_total_price.transform('sum')
tmp_df_products_share['product_qty_share_per_order'] = tmp_df_products_share['product_qty'] / tmp_df_products_share['products_cnt']
tmp_df_products_share['order_total_price_share_per_order'] = tmp_df_products_share['product_total_price'] / tmp_df_products_share['order_total_price']
tmp_df_products_share = (tmp_df_products_share.groupby('product_id', as_index=False)
                      .agg(
                          avg_product_qty_per_order = ('product_qty', 'mean')
                          , avg_product_qty_share_per_order = ('product_qty_share_per_order', 'mean')
                          , avg_order_total_price_share_per_order = ('order_total_price_share_per_order', 'mean')
                      )
)
Merge tables.
Check key mismatches.
fron.analyze_join_keys(tmp_df_products, tmp_df_products_share, "product_id", how='left')
| Type | Left-only keys | Right-only keys | Left size | Right size | Left join size |
|---|---|---|---|---|---|
| 1:1 | 0 | 0 | 32,122 | 32,122 | 32,122 |
Merge tables.
tmp_df_products = tmp_df_products.merge(tmp_df_products_share, on='product_id', how='left')
We will merge this with the main products dataframe.
Check key mismatches.
fron.analyze_join_keys(df_products, tmp_df_products, "product_id", how='left')
| Type | Left-only keys | Right-only keys | Left size | Right size | Left join size |
|---|---|---|---|---|---|
| 1:1 | 829 | 0 | 32,951 | 32,122 | 32,951 |
Missing values will appear for products that were never sold.
Merge tables.
df_products = df_products.merge(tmp_df_products, on='product_id', how='left')
Let’s look at the missing values.
df_products.explore.detect_anomalies()
| Count | Percent | |
|---|---|---|
| product_name_lenght | 610 | 1.85% |
| product_description_lenght | 610 | 1.85% |
| product_canceled_orders_cnt | 32528 | 98.72% |
| product_sales_cnt | 829 | 2.52% |
| total_units_sold | 829 | 2.52% |
| total_sales_amount | 829 | 2.52% |
| avg_price | 829 | 2.52% |
| min_price | 829 | 2.52% |
| max_price | 829 | 2.52% |
| price_range | 829 | 2.52% |
| avg_product_qty_per_order | 829 | 2.52% |
| avg_product_qty_share_per_order | 829 | 2.52% |
| avg_order_total_price_share_per_order | 829 | 2.52% |
All missing values are expected.
Enriching Table df_sellers#
From Tables df_items and df_products#
From Table df_items we will select only sales.
Check key mismatches.
fron.analyze_join_keys(df_items, df_sales[['order_id']], "order_id", how='inner')
| Type | Left-only keys | Right-only keys | Left size | Right size | Inner join size |
|---|---|---|---|---|---|
| N:1 | 2,007 | 0 | 112,279 | 96,346 | 110,021 |
tmp_df_items = df_items.merge(df_sales[['order_id']], on='order_id', how='inner')
We will add product information.
Check key mismatches.
fron.analyze_join_keys(tmp_df_items, df_products, "product_id", how='left')
| Type | Left-only keys | Right-only keys | Left size | Right size | Left join size |
|---|---|---|---|---|---|
| N:1 | 0 | 829 | 110,021 | 32,951 | 110,021 |
Merge tables.
tmp_df_items_prods = tmp_df_items.merge(df_products, on='product_id', how='left')
We will create the following metrics for each seller:
Total products sold
Count of unique products sold
Number of orders
Total sales value
Average carrier handoff delay
Average number of items per order
Average order value
Average item price
Average product weight
tmp_df_items_prods_agg_1 = (
    tmp_df_items_prods.groupby('seller_id', as_index=False)
    .agg(
        products_cnt = ('product_id', 'count')
        , unique_products_cnt = ('product_id', 'nunique')
        , orders_cnt = ('order_id', 'nunique')
        , revenue = ('price', 'sum')
        , avg_carrier_delivery_delay_days = ('carrier_delivery_delay_days', 'mean')
    )
)
tmp_df_items_prods_agg_2 = (
    tmp_df_items_prods.groupby(['seller_id', 'order_id'], as_index=False)
    .agg(
        products_cnt = ('product_id', 'count')
        , order_total_price = ('price', 'sum')
        , avg_product_price = ('price', 'mean')
    )
    .groupby('seller_id', as_index=False)
    .agg(
        avg_prouducts_cnt = ('products_cnt', 'mean')
        , avg_order_total_price = ('order_total_price', 'mean')
        , avg_product_price = ('avg_product_price', 'mean')
    )
)
Important note for average weight calculation:
We must remove duplicates to calculate averages based on unique products only.
tmp_df_items_prods_agg_3 = (
     tmp_df_items_prods.drop_duplicates(subset = ['seller_id', 'product_id'])
     .groupby('seller_id', as_index=False)
     .agg(
          avg_product_weight_kg = ('product_weight_g', 'mean')
     )
)
tmp_df_items_prods_agg_3['avg_product_weight_kg'] = (tmp_df_items_prods_agg_3['avg_product_weight_kg'] / 1000).round(2)
We will merge intermediate dataframes.
fron.analyze_join_keys(tmp_df_items_prods_agg_1, tmp_df_items_prods_agg_2, "seller_id", how='left')
| Type | Left-only keys | Right-only keys | Left size | Right size | Left join size |
|---|---|---|---|---|---|
| 1:1 | 0 | 0 | 2,947 | 2,947 | 2,947 |
tmp_df_items_prods_agg = tmp_df_items_prods_agg_1.merge(tmp_df_items_prods_agg_2, on='seller_id', how='left')
fron.analyze_join_keys(tmp_df_items_prods_agg, tmp_df_items_prods_agg_3, "seller_id", how='left')
| Type | Left-only keys | Right-only keys | Left size | Right size | Left join size |
|---|---|---|---|---|---|
| 1:1 | 0 | 0 | 2,947 | 2,947 | 2,947 |
tmp_df_items_prods_agg = tmp_df_items_prods_agg.merge(tmp_df_items_prods_agg_3, on='seller_id', how='left')
We will add new fields to df_sellers.
Check key mismatches.
fron.analyze_join_keys(df_sellers, tmp_df_items_prods_agg, "seller_id", how='left')
| Type | Left-only keys | Right-only keys | Left size | Right size | Left join size |
|---|---|---|---|---|---|
| 1:1 | 148 | 0 | 3,095 | 2,947 | 3,095 |
Sellers whose products were never purchased (or whose orders were canceled) will have missing values. This is expected.
Merge tables.
df_sellers = df_sellers.merge(tmp_df_items_prods_agg, on='seller_id', how='left')
From Table df_geolocations#
Check key mismatches.
fron.analyze_join_keys(df_sellers, df_geolocations, left_on='seller_zip_code_prefix', right_on='geolocation_zip_code_prefix', how='left')
| Type | Left-only keys | Right-only keys | Left size | Right size | Left join size |
|---|---|---|---|---|---|
| N:1 | 7 | 16,776 | 3,095 | 19,015 | 3,095 |
As previously established, some sellers’ zip prefixes are missing from the geolocation table.
We will check using truncated prefixes.
fron.analyze_join_keys(df_sellers, df_geolocations, left_on='seller_zip_code_prefix_3_digits', right_on='geolocation_zip_code_prefix_3_digits', how='left')
| Type | Left-only keys | Right-only keys | Left size | Right size | Left join size |
|---|---|---|---|---|---|
| N:M | 0 | 218 | 3,095 | 19,015 | 98,152 |
We will handle this the same way as with customers:
Keep as-is for geo-analysis (no missing data)
Maintain precision for distance calculations (accept missing values)
Use left join to preserve all sellers
df_sellers = df_sellers.merge(df_geolocations, left_on='seller_zip_code_prefix', right_on='geolocation_zip_code_prefix', how='left')
df_sellers.rename(columns={'geolocation_lat': 'lat_seller', 'geolocation_lng': 'lng_seller'}, inplace=True)
df_sellers.drop(['geolocation_zip_code_prefix', 'geolocation_zip_code_prefix_3_digits'], axis=1, inplace=True)
Let’s look at the missing values.
df_sellers.explore.detect_anomalies()
| Count | Percent | |
|---|---|---|
| products_cnt | 148 | 4.78% |
| unique_products_cnt | 148 | 4.78% |
| orders_cnt | 148 | 4.78% |
| revenue | 148 | 4.78% |
| avg_carrier_delivery_delay_days | 149 | 4.81% |
| avg_prouducts_cnt | 148 | 4.78% |
| avg_order_total_price | 148 | 4.78% |
| avg_product_price | 148 | 4.78% |
| avg_product_weight_kg | 148 | 4.78% |
| lat_seller | 7 | 0.23% |
| lng_seller | 7 | 0.23% |
| in_south_america | 7 | 0.23% |
We will clear temporary variables from memory.
for var_name in list(globals().keys()):
    if var_name.startswith('tmp_'):
        del globals()[var_name]