Analysis of Customer Segments#
pb.configure(
    df = df_customers
    , metric = 'customer_unique_id'
    , metric_label = 'Share of Customers'
    , agg_func = 'nunique'
    , norm_by='all'
    , axis_sort_order='descending'
    , text_auto='.1%'
)
Save customer metrics in a separate list.
customers_dim = [
    "activity_segment"
    , "value_segment"
    , "purchase_freq_segment"
    , "repeat_segment"
    , "loyalty_segment"
    , "risk_segment"
    , "weekday_segment"
    , "installment_segment"
    , "products_cnt_segment"
    , "weight_segment"
    , "customer_top_purchase_weekdays"
    , "customer_payment_types"
    , "customer_top_product_categories"
    , "customer_top_general_product_categories"
    , "customer_city"
    , "customer_state"
]
Distribution of Customers by Segments#
Examine how customers are distributed across each segment and compare key metrics between segments.
Select the following key customer metrics.
total_customer_payment
avg_total_order_payment
buys_cnt
from_first_to_last_days
customer_avg_reviews_score
avg_products_cnt
avg_delivery_delay_days
avg_order_total_weight_kg
selected_metrics = [
    'total_customer_payment',
    'avg_total_order_payment',
    'buys_cnt',
    'from_first_to_last_days',
    'customer_avg_reviews_score',
    'canceled_share',
    'purchase_weekend_share',
    'avg_products_cnt',
    'avg_delivery_delay_days',
    'avg_order_total_weight_kg'
]
Give more readable names for the metrics on the graphs.
metric_labels = {
    'total_customer_payment': 'Total Spending',
    'avg_total_order_payment': 'Average Order Value',
    'buys_cnt': 'Number of Purchases',
    'from_first_to_last_days': 'Customer Lifetime',
    'customer_avg_reviews_score': 'Average Rating',
    'canceled_share': 'Order Cancelation Rate',
    'purchase_weekend_share': 'Weekend Purchase Ratio',
    'avg_products_cnt': 'Average Items per Order',
    'avg_delivery_delay_days': 'Avg Delivery Delay',
    'avg_order_total_weight_kg': 'Avg Order Weight'
}
labels_for_polar={**base_labels, **metric_labels}
By Activity Segment
fig = df_customers.analysis.segment_polar(
    metrics=selected_metrics
    , dimension='activity_segment'
    , count_column='customer_unique_id'
    , labels=labels_for_polar
)
pb.to_slide(fig)
df_customers.analysis.segment_table(
    metrics=selected_metrics
    , dimension='activity_segment'
    , count_column='customer_unique_id'
)
fig.show()
| activity_segment | Core | Potential Core | Short-Lived Repeat | One Time | Never Converted |
|---|---|---|---|---|---|
| % of Total Count | 0.16% | 1.35% | 1.40% | 94.43% | 2.65% |
| total_customer_payment | 431.98 | 230.84 | 207.61 | 105.40 | NaN |
| avg_total_order_payment | 127.38 | 114.19 | 103.31 | 105.40 | NaN |
| buys_cnt | 3.00 | 2.00 | 2.00 | 1.00 | NaN |
| from_first_to_last_days | 206.22 | 126.08 | 0.00 | NaN | NaN |
| customer_avg_reviews_score | 4.67 | 4.50 | 4.50 | 5.00 | NaN |
| canceled_share | 0.00 | 0.00 | 0.00 | 0.00 | 0.00 |
| purchase_weekend_share | 0.23 | 0.00 | 0.00 | 0.00 | NaN |
| avg_products_cnt | 1.00 | 1.00 | 1.00 | 1.00 | NaN |
| avg_delivery_delay_days | -12.69 | -11.71 | -11.89 | -11.57 | NaN |
| avg_order_total_weight_kg | 1.11 | 1.00 | 1.00 | 0.75 | NaN |
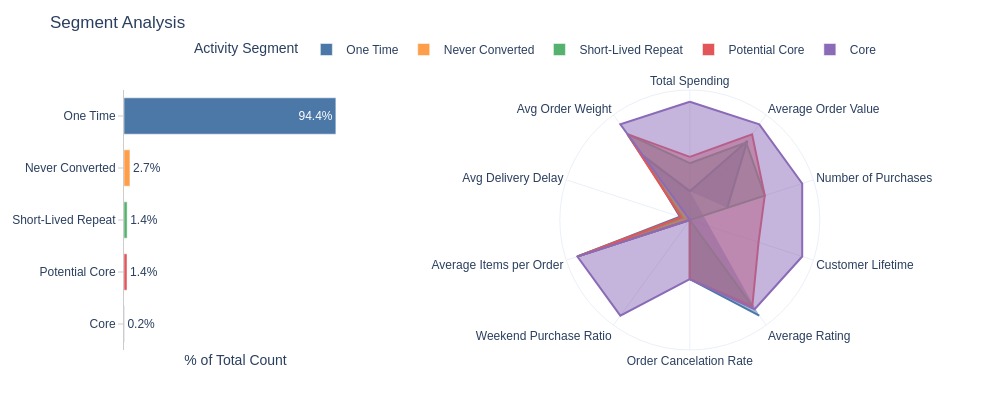
Key Observations:
3% of all customers made no successful purchases
94% of successful customers made only one purchase
1% in Potential Core segment
1% in Short-Lived Repeat segment
Core audience segment is less than 1%
Highest metric values in Core segment, followed by Potential Core
Median review score is higher for one-time purchasers
Core segment has best delivery time performance, One Time has worst
We will not consider the segment of customers who did not make any successful purchases, as their values will be repetitive.
By Purchase Amount Segment
fig = df_customers.analysis.segment_polar(
    metrics=selected_metrics
    , dimension='value_segment'
    , exclude_segments=['Never Converted']
    , count_column='customer_unique_id'
    , labels=labels_for_polar
)
pb.to_slide(fig)
df_customers.analysis.segment_table(
    metrics=selected_metrics
    , dimension='value_segment'
    , exclude_segments=['Never Converted']
    , count_column='customer_unique_id'
)
fig.show()
| value_segment | High | Medium | Low |
|---|---|---|---|
| % of Total Count | 24.40% | 48.63% | 24.31% |
| total_customer_payment | 276.11 | 107.78 | 44.00 |
| avg_total_order_payment | 263.85 | 106.29 | 44.00 |
| buys_cnt | 1.00 | 1.00 | 1.00 |
| from_first_to_last_days | 45.81 | 21.27 | 3.86 |
| customer_avg_reviews_score | 5.00 | 5.00 | 5.00 |
| canceled_share | 0.00 | 0.00 | 0.00 |
| purchase_weekend_share | 0.00 | 0.00 | 0.00 |
| avg_products_cnt | 1.00 | 1.00 | 1.00 |
| avg_delivery_delay_days | -12.24 | -12.03 | -10.60 |
| avg_order_total_weight_kg | 2.30 | 0.95 | 0.25 |
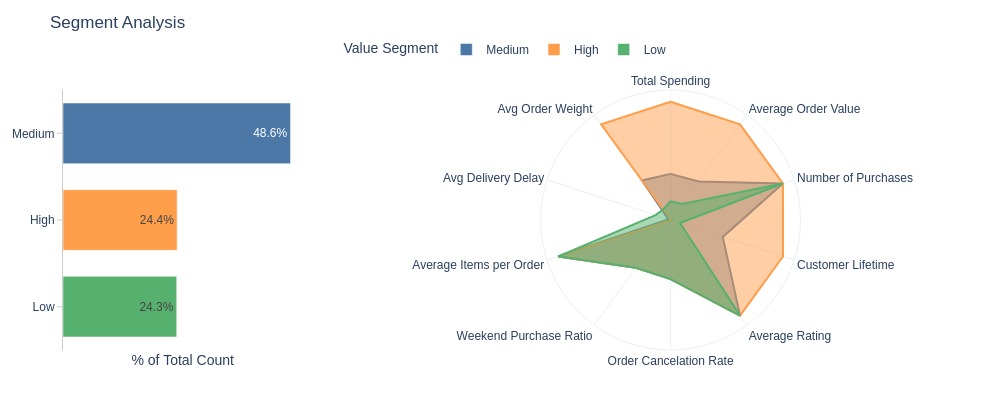
Key Observations:
49% of customers are in medium payment tier
24% in high payment tier, 24% in low
High payment tier spends most (expected)
No difference in median review scores across tiers
High payment tier has higher median order weight
By Purchase Frequency Segment
fig = df_customers.analysis.segment_polar(
    metrics=selected_metrics
    , dimension='purchase_freq_segment'
    , exclude_segments=['Never Converted', 'Non-Repeating']
    , count_column='customer_unique_id'
    , labels=labels_for_polar
)
pb.to_slide(fig)
df_customers.analysis.segment_table(
    metrics=selected_metrics
    , dimension='purchase_freq_segment'
    , exclude_segments=['Never Converted']
    , count_column='customer_unique_id'
)
fig.show()
| purchase_freq_segment | Quarterly | Semiannual | Annual | Monthly | Weekly | Non-Repeating |
|---|---|---|---|---|---|---|
| % of Total Count | 0.56% | 0.45% | 0.48% | 0.41% | 1.01% | 94.43% |
| total_customer_payment | 247.41 | 248.52 | 228.49 | 234.81 | 200.29 | 105.40 |
| avg_total_order_payment | 116.35 | 117.04 | 113.71 | 113.81 | 99.45 | 105.40 |
| buys_cnt | 2.00 | 2.00 | 2.00 | 2.00 | 2.00 | 1.00 |
| from_first_to_last_days | 59.66 | 134.01 | 269.91 | 17.52 | 0.00 | NaN |
| customer_avg_reviews_score | 4.50 | 4.50 | 4.83 | 4.50 | 4.50 | 5.00 |
| canceled_share | 0.00 | 0.00 | 0.00 | 0.00 | 0.00 | 0.00 |
| purchase_weekend_share | 0.00 | 0.00 | 0.00 | 0.00 | 0.00 | 0.00 |
| avg_products_cnt | 1.00 | 1.00 | 1.00 | 1.00 | 1.00 | 1.00 |
| avg_delivery_delay_days | -11.17 | -11.82 | -12.70 | -11.72 | -11.94 | -11.57 |
| avg_order_total_weight_kg | 1.01 | 1.07 | 0.93 | 1.05 | 0.99 | 0.75 |
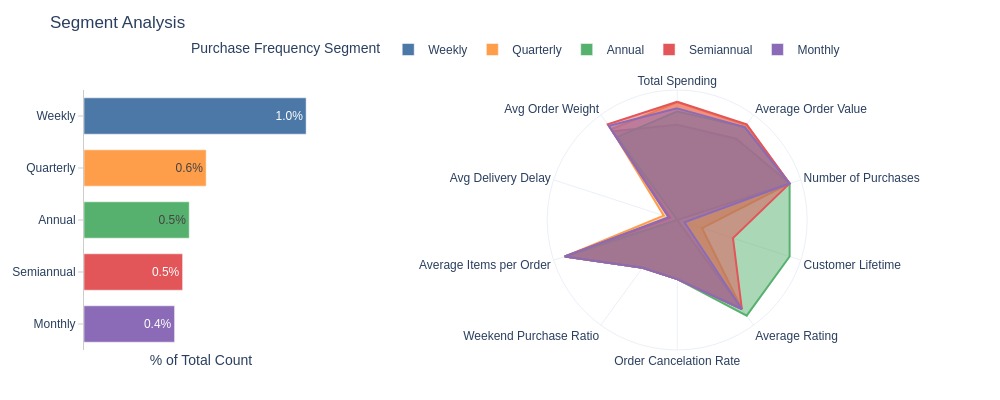
Key Observations:
Among repeat buyers:
Weekly purchasers: 1% (most common frequency)
Quarterly/Semi-annual buyers show better metrics than other frequencies
By Time to Next Purchase Segment
fig = df_customers.analysis.segment_polar(
    metrics=selected_metrics
    , dimension='repeat_segment'
    , exclude_segments=['Never Converted', 'Non-Repeating']
    , count_column='customer_unique_id'
    , labels=labels_for_polar
)
pb.to_slide(fig)
df_customers.analysis.segment_table(
    metrics=selected_metrics
    , dimension='repeat_segment'
    , exclude_segments=['Never Converted']
    , count_column='customer_unique_id'
)
fig.show()
| repeat_segment | Slow Repeat | Medium Repeat | Fast Repeat | Non-Repeating |
|---|---|---|---|---|
| % of Total Count | 1.13% | 0.56% | 1.22% | 94.43% |
| total_customer_payment | 239.16 | 236.61 | 207.61 | 105.40 |
| avg_total_order_payment | 116.12 | 115.39 | 101.41 | 105.40 |
| buys_cnt | 2.00 | 2.00 | 2.00 | 1.00 |
| from_first_to_last_days | 167.92 | 34.01 | 0.00 | NaN |
| customer_avg_reviews_score | 4.50 | 4.50 | 4.50 | 5.00 |
| canceled_share | 0.00 | 0.00 | 0.00 | 0.00 |
| purchase_weekend_share | 0.00 | 0.00 | 0.00 | 0.00 |
| avg_products_cnt | 1.00 | 1.00 | 1.00 | 1.00 |
| avg_delivery_delay_days | -11.83 | -11.39 | -11.97 | -11.57 |
| avg_order_total_weight_kg | 1.02 | 0.98 | 1.00 | 0.75 |
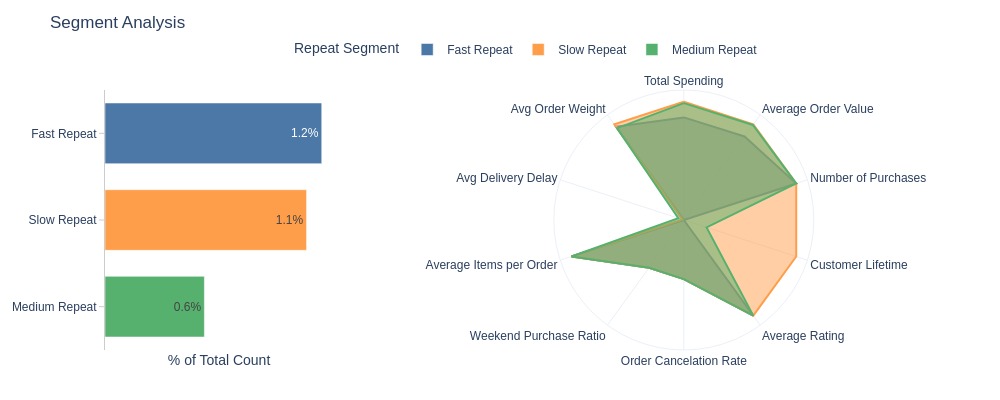
Key Observations:
Among repeat buyers, medium repurchase time segment is smallest (<1%)
Fast repurchase segment shows worse metrics than medium/slow segments
By Loyalty Segment
fig = df_customers.analysis.segment_polar(
    metrics=selected_metrics
    , dimension='loyalty_segment'
    , exclude_segments=['Never Converted']
    , count_column='customer_unique_id'
    , labels=labels_for_polar
)
pb.to_slide(fig)
df_customers.analysis.segment_table(
    metrics=selected_metrics
    , dimension='loyalty_segment'
    , exclude_segments=['Never Converted']
    , count_column='customer_unique_id'
)
fig.show()
| loyalty_segment | Neutral | Critic | Promoter |
|---|---|---|---|
| % of Total Count | 27.70% | 12.86% | 56.79% |
| total_customer_payment | 106.77 | 121.09 | 105.74 |
| avg_total_order_payment | 103.55 | 118.84 | 103.65 |
| buys_cnt | 1.00 | 1.00 | 1.00 |
| from_first_to_last_days | 48.09 | 1.92 | 33.00 |
| customer_avg_reviews_score | 4.00 | 1.00 | 5.00 |
| canceled_share | 0.00 | 0.00 | 0.00 |
| purchase_weekend_share | 0.00 | 0.00 | 0.00 |
| avg_products_cnt | 1.00 | 1.00 | 1.00 |
| avg_delivery_delay_days | -11.26 | -7.21 | -12.31 |
| avg_order_total_weight_kg | 0.75 | 0.90 | 0.70 |
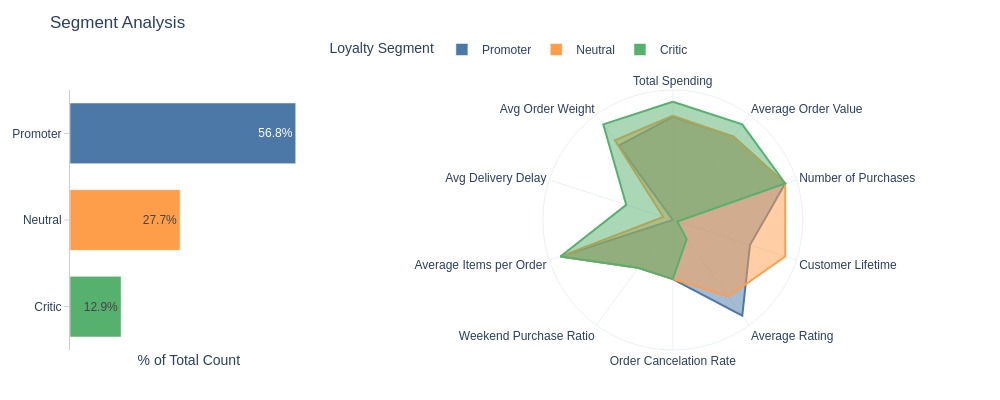
Key Observations:
Loyalty segments:
Promoters: 58%
Critics: 13% (lowest)
Critics have:
Higher total payment and AOV than promoters/neutrals
Shortest time between first/last purchase (rarely return)
Heavier average orders
Worst median delivery time performance
By Risk Segment
fig = df_customers.analysis.segment_polar(
    metrics=selected_metrics
    , dimension='risk_segment'
    , count_column='customer_unique_id'
    , labels=labels_for_polar
)
pb.to_slide(fig)
df_customers.analysis.segment_table(
    metrics=selected_metrics
    , dimension='risk_segment'
    , exclude_segments=['Never Converted']
    , count_column='customer_unique_id'
)
fig.show()
| risk_segment | Risky | Reliable |
|---|---|---|
| % of Total Count | 0.60% | 99.40% |
| total_customer_payment | 145.72 | 107.78 |
| avg_total_order_payment | 119.97 | 105.63 |
| buys_cnt | 1.00 | 1.00 |
| from_first_to_last_days | 7.79 | 34.92 |
| customer_avg_reviews_score | 4.00 | 5.00 |
| canceled_share | 1.00 | 0.00 |
| purchase_weekend_share | 0.00 | 0.00 |
| avg_products_cnt | 1.00 | 1.00 |
| avg_delivery_delay_days | -10.83 | -11.61 |
| avg_order_total_weight_kg | 1.34 | 0.75 |
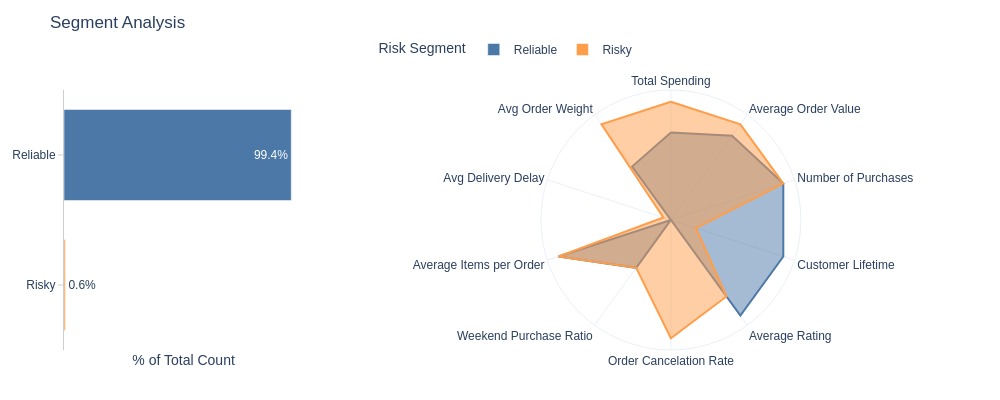
Key Observations:
99.5% of customers are “Reliable” (no order cancellations)
Cancellation segment has:
Much shorter time between first/second purchase
Higher median total spend and AOV
By Day of the Week Segment
fig = df_customers.analysis.segment_polar(
    metrics=selected_metrics
    , dimension='weekday_segment'
    , exclude_segments=['Never Converted']
    , count_column='customer_unique_id'
    , labels=labels_for_polar
)
pb.to_slide(fig)
df_customers.analysis.segment_table(
    metrics=selected_metrics
    , dimension='weekday_segment'
    , exclude_segments=['Never Converted']
    , count_column='customer_unique_id'
)
fig.show()
| weekday_segment | Weekend | Weekday |
|---|---|---|
| % of Total Count | 22.74% | 74.61% |
| total_customer_payment | 109.66 | 107.28 |
| avg_total_order_payment | 106.29 | 105.38 |
| buys_cnt | 1.00 | 1.00 |
| from_first_to_last_days | 51.33 | 25.32 |
| customer_avg_reviews_score | 5.00 | 5.00 |
| canceled_share | 0.00 | 0.00 |
| purchase_weekend_share | 1.00 | 0.00 |
| avg_products_cnt | 1.00 | 1.00 |
| avg_delivery_delay_days | -12.26 | -11.35 |
| avg_order_total_weight_kg | 0.79 | 0.75 |
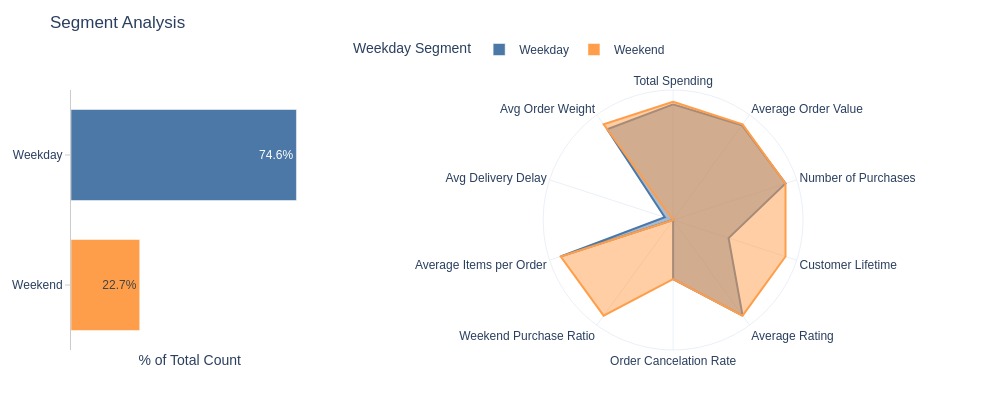
Key Observations:
75% of customers only purchased on weekdays
Weekend purchasers have significantly longer time between first/last purchase
By Installment Payment Segment
fig = df_customers.analysis.segment_polar(
    metrics=selected_metrics
    , dimension='installment_segment'
    , exclude_segments=['Never Converted']
    , count_column='customer_unique_id'
    , labels=labels_for_polar
)
pb.to_slide(fig)
df_customers.analysis.segment_table(
    metrics=selected_metrics
    , dimension='installment_segment'
    , exclude_segments=['Never Converted']
    , count_column='customer_unique_id'
)
fig.show()
| installment_segment | Installment | Full Pay |
|---|---|---|
| % of Total Count | 50.25% | 47.10% |
| total_customer_payment | 138.60 | 80.88 |
| avg_total_order_payment | 135.08 | 79.28 |
| buys_cnt | 1.00 | 1.00 |
| from_first_to_last_days | 43.21 | 23.21 |
| customer_avg_reviews_score | 5.00 | 5.00 |
| canceled_share | 0.00 | 0.00 |
| purchase_weekend_share | 0.00 | 0.00 |
| avg_products_cnt | 1.00 | 1.00 |
| avg_delivery_delay_days | -12.18 | -11.21 |
| avg_order_total_weight_kg | 1.00 | 0.55 |
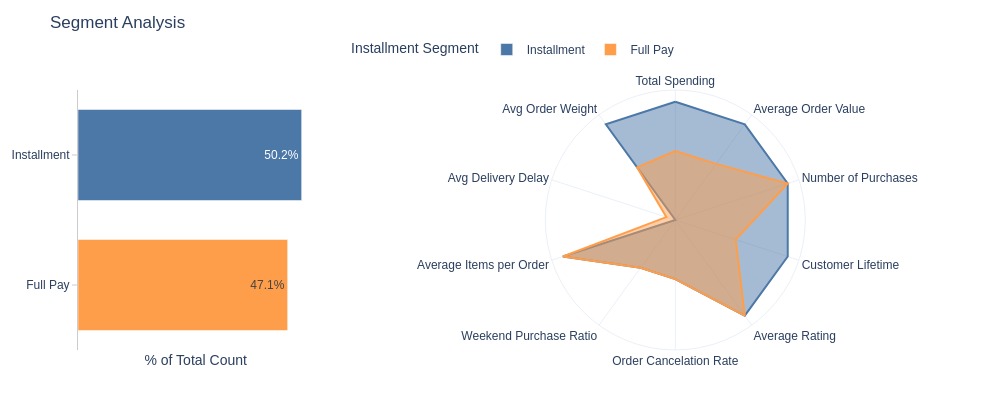
Key Observations:
50% used installments at least once
47% always paid in full
Installment users have significantly higher:
Median total spend
AOV
Order weight
Time between first/last purchase
By Average Number of Products per Order Segment
fig = df_customers.analysis.segment_polar(
    metrics=selected_metrics
    , dimension='products_cnt_segment'
    , exclude_segments=['Never Converted']
    , count_column='customer_unique_id'
    , labels=labels_for_polar
)
pb.to_slide(fig)
df_customers.analysis.segment_table(
    metrics=selected_metrics
    , dimension='products_cnt_segment'
    , exclude_segments=['Never Converted']
    , count_column='customer_unique_id'
)
fig.show()
| products_cnt_segment | Bulk Buyer | Single Product | Multi Product |
|---|---|---|---|
| % of Total Count | 2.18% | 87.47% | 7.70% |
| total_customer_payment | 251.54 | 101.37 | 162.45 |
| avg_total_order_payment | 241.43 | 99.40 | 154.31 |
| buys_cnt | 1.00 | 1.00 | 1.00 |
| from_first_to_last_days | 48.88 | 35.06 | 32.98 |
| customer_avg_reviews_score | 4.00 | 5.00 | 4.00 |
| canceled_share | 0.00 | 0.00 | 0.00 |
| purchase_weekend_share | 0.00 | 0.00 | 0.00 |
| avg_products_cnt | 3.00 | 1.00 | 2.00 |
| avg_delivery_delay_days | -12.37 | -11.45 | -12.29 |
| avg_order_total_weight_kg | 2.85 | 0.70 | 1.45 |
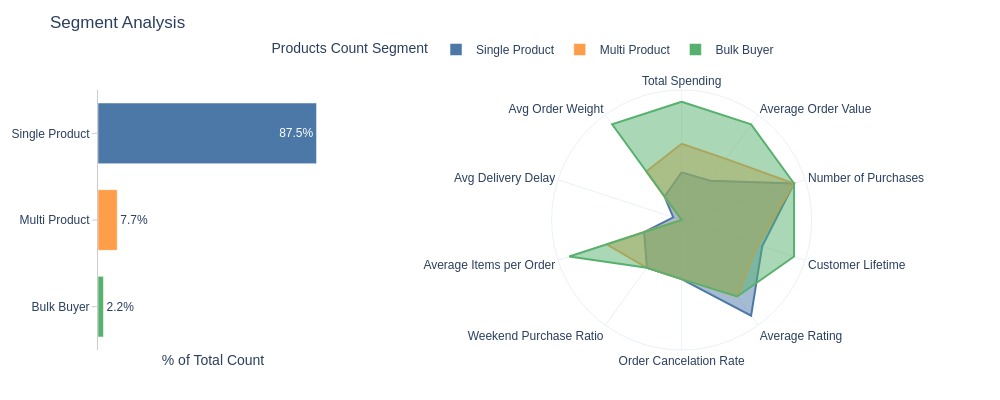
Key Observations:
88% of customers had ≤1 product per order
8% averaged 1-2 products
Only 2% averaged >2 products
Customers with 2+ products per order have significantly higher:
Median order weight
Total spend
AOV
Time between first/last purchase
By Average Weight of Order Segment
fig = df_customers.analysis.segment_polar(
    metrics=selected_metrics
    , dimension='weight_segment'
    , exclude_segments=['Never Converted']
    , count_column='customer_unique_id'
    , labels=labels_for_polar
)
pb.to_slide(fig)
df_customers.analysis.segment_table(
    metrics=selected_metrics
    , dimension='weight_segment'
    , exclude_segments=['Never Converted']
    , count_column='customer_unique_id'
)
fig.show()
| weight_segment | Heavy | Light | Medium |
|---|---|---|---|
| % of Total Count | 21.30% | 38.98% | 37.07% |
| total_customer_payment | 193.72 | 65.53 | 112.34 |
| avg_total_order_payment | 189.37 | 64.82 | 109.86 |
| buys_cnt | 1.00 | 1.00 | 1.00 |
| from_first_to_last_days | 38.67 | 27.17 | 39.88 |
| customer_avg_reviews_score | 5.00 | 5.00 | 5.00 |
| canceled_share | 0.00 | 0.00 | 0.00 |
| purchase_weekend_share | 0.00 | 0.00 | 0.00 |
| avg_products_cnt | 1.00 | 1.00 | 1.00 |
| avg_delivery_delay_days | -12.07 | -11.32 | -12.05 |
| avg_order_total_weight_kg | 6.20 | 0.25 | 1.10 |
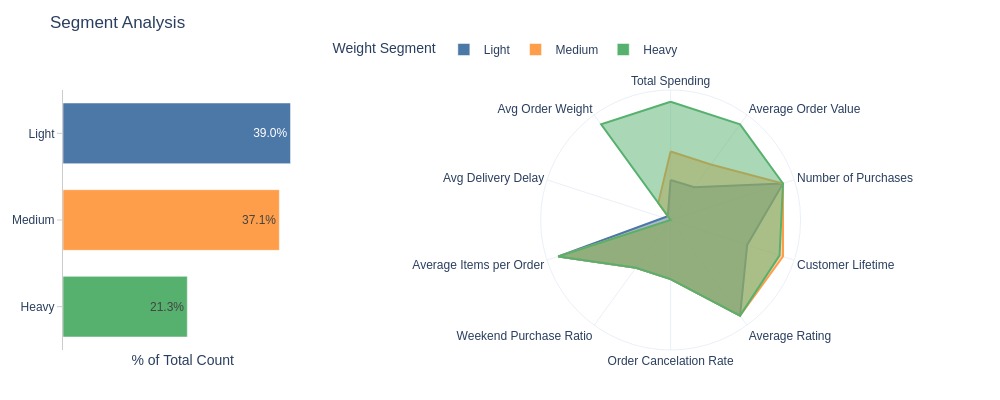
Key Observations:
Order weight segments:
Light: 39%
Medium: 37%
Heavy: 21%
Heavy segment has significantly higher total spend and AOV
Light segment has shorter time between first/last purchase
By Top Days of the Week
fig = df_customers.analysis.segment_polar(
    metrics=selected_metrics
    , dimension='customer_top_purchase_weekdays'
    , exclude_segments=['Never Converted']
    , max_segments=5
    , count_column='customer_unique_id'
    , labels=labels_for_polar
)
pb.to_slide(fig)
df_customers.analysis.segment_table(
    metrics=selected_metrics
    , dimension='customer_top_purchase_weekdays'
    , exclude_segments=['Never Converted']
    , max_segments=5
    , count_column='customer_unique_id'
)
fig.show()
| customer_top_purchase_weekdays | Monday | Tuesday | Friday | Wednesday | Thursday |
|---|---|---|---|---|---|
| % of Total Count | 15.57% | 15.35% | 13.57% | 14.93% | 14.14% |
| total_customer_payment | 108.14 | 106.29 | 106.06 | 105.29 | 105.29 |
| avg_total_order_payment | 107.45 | 105.38 | 104.65 | 104.12 | 104.28 |
| buys_cnt | 1.00 | 1.00 | 1.00 | 1.00 | 1.00 |
| from_first_to_last_days | 0.00 | 0.00 | 0.00 | 0.00 | 0.00 |
| customer_avg_reviews_score | 5.00 | 5.00 | 5.00 | 5.00 | 5.00 |
| canceled_share | 0.00 | 0.00 | 0.00 | 0.00 | 0.00 |
| purchase_weekend_share | 0.00 | 0.00 | 0.00 | 0.00 | 0.00 |
| avg_products_cnt | 1.00 | 1.00 | 1.00 | 1.00 | 1.00 |
| avg_delivery_delay_days | -11.16 | -11.30 | -11.36 | -11.60 | -11.97 |
| avg_order_total_weight_kg | 0.75 | 0.75 | 0.75 | 0.70 | 0.75 |
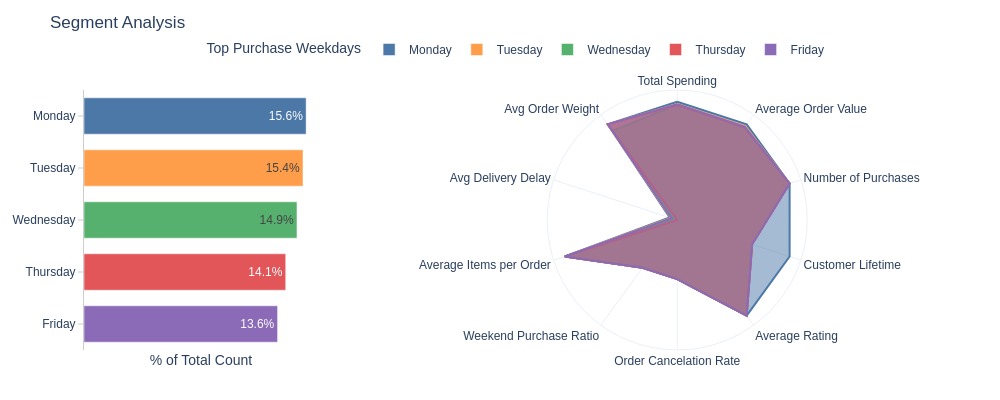
Key Observations:
Most customers only purchased on one weekday (expected due to low repeat purchases)
Top 3 purchase days: Monday, Tuesday, Wednesday
Monday-only buyers have longer time between first/last purchase than other top segments (possibly coincidental)
By Top Payment Types
fig = df_customers.analysis.segment_polar(
    metrics=selected_metrics
    , dimension='customer_payment_types'
    , exclude_segments=['Never Converted']
    , max_segments=5
    , count_column='customer_unique_id'
    , labels=labels_for_polar
    , text_auto=True
)
pb.to_slide(fig)
df_customers.analysis.segment_table(
    metrics=selected_metrics
    , dimension='customer_payment_types'
    , exclude_segments=['Never Converted']
    , max_segments=5
    , count_column='customer_unique_id'
)
fig.show()
| customer_payment_types | Credit Card, Voucher | Credit Card | Boleto | Debit Card | Voucher |
|---|---|---|---|---|---|
| % of Total Count | 2.26% | 72.61% | 19.26% | 1.49% | 1.45% |
| total_customer_payment | 107.25 | 112.64 | 95.30 | 89.88 | 71.14 |
| avg_total_order_payment | 102.73 | 109.93 | 93.82 | 89.75 | 70.63 |
| buys_cnt | 1.00 | 1.00 | 1.00 | 1.00 | 1.00 |
| from_first_to_last_days | 78.03 | 30.76 | 15.98 | 0.00 | 4.69 |
| customer_avg_reviews_score | 5.00 | 5.00 | 5.00 | 5.00 | 5.00 |
| canceled_share | 0.00 | 0.00 | 0.00 | 0.00 | 0.00 |
| purchase_weekend_share | 0.00 | 0.00 | 0.00 | 0.00 | 0.00 |
| avg_products_cnt | 1.00 | 1.00 | 1.00 | 1.00 | 1.00 |
| avg_delivery_delay_days | -12.23 | -12.08 | -11.03 | -10.41 | -11.33 |
| avg_order_total_weight_kg | 0.85 | 0.80 | 0.70 | 0.55 | 0.56 |
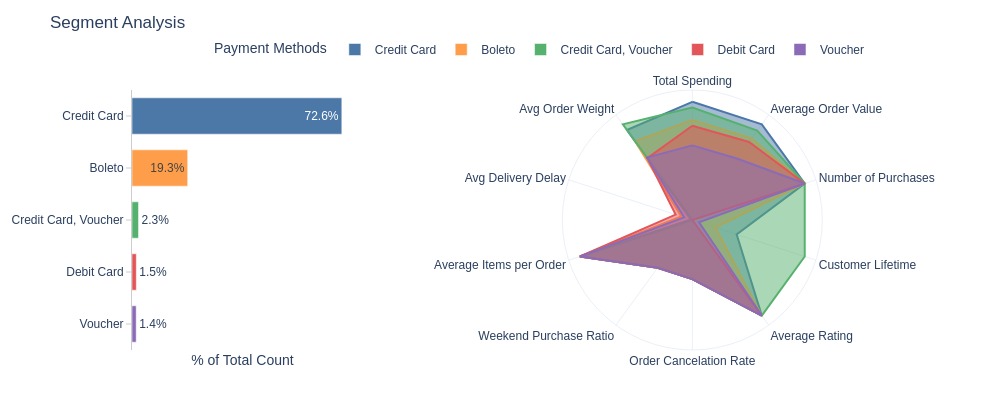
Key Observations:
Payment methods:
Credit card only: 73%
Boleto only: 19%
Voucher-only segment has lower total spend and AOV than other top payment segments
By Top Product Categories
fig = df_customers.analysis.segment_polar(
    metrics=selected_metrics
    , dimension='customer_top_product_categories'
    , exclude_segments=['Never Converted']
    , max_segments=5
    , count_column='customer_unique_id'
    , labels=labels_for_polar
)
pb.to_slide(fig)
df_customers.analysis.segment_table(
    metrics=selected_metrics
    , dimension='customer_top_product_categories'
    , max_segments=5
    , exclude_segments=['Never Converted']
    , count_column='customer_unique_id'
)
fig.show()
| customer_top_product_categories | Sports Leisure | Furniture Decor | Bed Bath Table | Health Beauty | Computers Accessories |
|---|---|---|---|---|---|
| % of Total Count | 7.35% | 5.88% | 8.84% | 8.57% | 6.47% |
| total_customer_payment | 112.43 | 105.56 | 106.16 | 105.37 | 104.18 |
| avg_total_order_payment | 111.02 | 103.90 | 105.28 | 104.26 | 103.16 |
| buys_cnt | 1.00 | 1.00 | 1.00 | 1.00 | 1.00 |
| from_first_to_last_days | 26.99 | 0.02 | 0.96 | 13.78 | 0.00 |
| customer_avg_reviews_score | 5.00 | 5.00 | 5.00 | 5.00 | 5.00 |
| canceled_share | 0.00 | 0.00 | 0.00 | 0.00 | 0.00 |
| purchase_weekend_share | 0.00 | 0.00 | 0.00 | 0.00 | 0.00 |
| avg_products_cnt | 1.00 | 1.00 | 1.00 | 1.00 | 1.00 |
| avg_delivery_delay_days | -11.82 | -11.39 | -11.24 | -11.96 | -12.24 |
| avg_order_total_weight_kg | 0.80 | 1.80 | 1.38 | 0.46 | 0.35 |
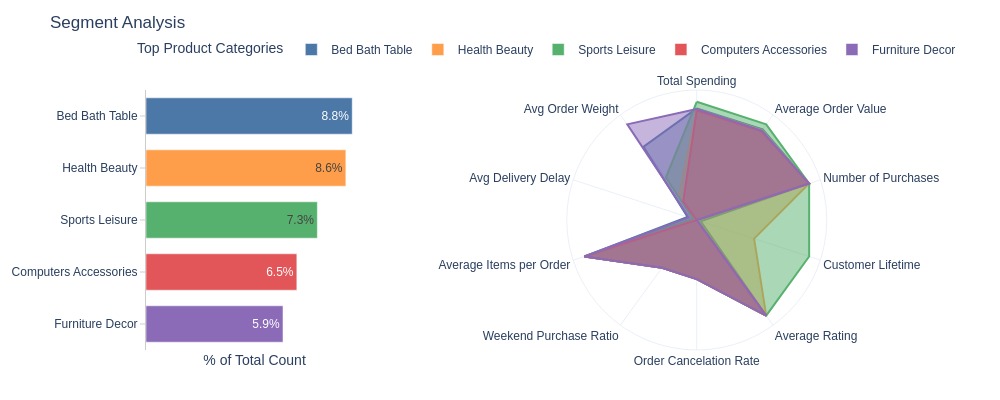
Key Observations:
Most customers only bought from:
Bed Bath Table
Health Beauty categories
Sports goods buyers have longer time between first/last purchase than other category segments
By Top General Product Categories
fig = df_customers.analysis.segment_polar(
    metrics=selected_metrics
    , dimension='customer_top_general_product_categories'
    , exclude_segments=['Never Converted']
    , max_segments=5
    , count_column='customer_unique_id'
    , labels=labels_for_polar
)
pb.to_slide(fig)
df_customers.analysis.segment_table(
    metrics=selected_metrics
    , dimension='customer_top_general_product_categories'
    , exclude_segments=['Never Converted']
    , max_segments=5
    , count_column='customer_unique_id'
)
fig.show()
| customer_top_general_product_categories | Furniture | Electronics | Entertainment | Home & Garden | Beauty & Health |
|---|---|---|---|---|---|
| % of Total Count | 17.38% | 25.99% | 11.62% | 13.73% | 11.65% |
| total_customer_payment | 115.81 | 97.62 | 107.98 | 103.53 | 106.19 |
| avg_total_order_payment | 113.62 | 96.65 | 107.00 | 102.16 | 105.37 |
| buys_cnt | 1.00 | 1.00 | 1.00 | 1.00 | 1.00 |
| from_first_to_last_days | 1.32 | 20.82 | 24.83 | 9.38 | 16.93 |
| customer_avg_reviews_score | 5.00 | 5.00 | 5.00 | 5.00 | 5.00 |
| canceled_share | 0.00 | 0.00 | 0.00 | 0.00 | 0.00 |
| purchase_weekend_share | 0.00 | 0.00 | 0.00 | 0.00 | 0.00 |
| avg_products_cnt | 1.00 | 1.00 | 1.00 | 1.00 | 1.00 |
| avg_delivery_delay_days | -11.31 | -11.49 | -12.02 | -11.98 | -12.04 |
| avg_order_total_weight_kg | 1.70 | 0.34 | 0.80 | 1.55 | 0.43 |
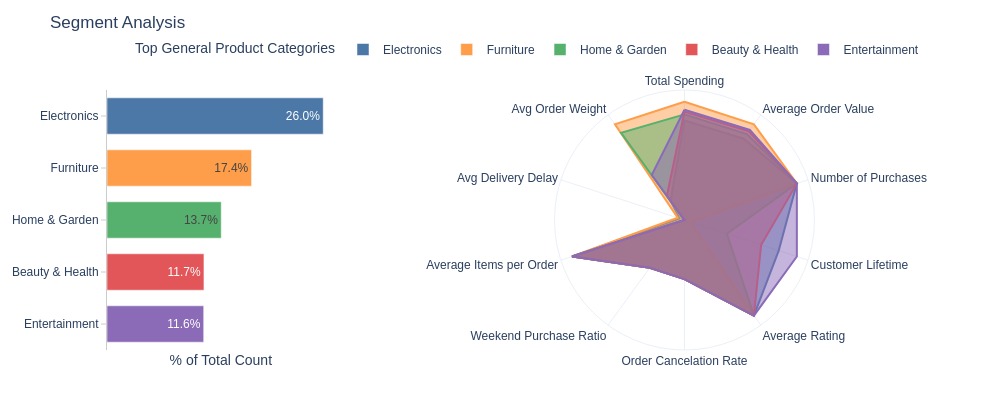
Key Observations:
Top generalized category segments:
Electronics only: 26%
Furniture only: 17%
Home & Garden only: 14%
By Customer State
fig = df_customers.analysis.segment_polar(
    metrics=selected_metrics
    , dimension='customer_state'
    , exclude_segments=['Never Converted']
    , max_segments=5
    , count_column='customer_unique_id'
    , labels=labels_for_polar
)
pb.to_slide(fig)
df_customers.analysis.segment_table(
    metrics=selected_metrics
    , dimension='customer_state'
    , max_segments=5
    , exclude_segments=['Never Converted']
    , count_column='customer_unique_id'
)
fig.show()
| customer_state | Rio de Janeiro | Sao Paulo | Rio Grande do Sul | Minas Gerais | Parana |
|---|---|---|---|---|---|
| % of Total Count | 12.87% | 41.95% | 5.48% | 11.71% | 5.08% |
| total_customer_payment | 115.45 | 96.46 | 113.35 | 111.91 | 107.01 |
| avg_total_order_payment | 113.11 | 93.85 | 108.99 | 108.81 | 105.28 |
| buys_cnt | 1.00 | 1.00 | 1.00 | 1.00 | 1.00 |
| from_first_to_last_days | 40.06 | 38.67 | 43.20 | 34.15 | 31.67 |
| customer_avg_reviews_score | 5.00 | 5.00 | 5.00 | 5.00 | 5.00 |
| canceled_share | 0.00 | 0.00 | 0.00 | 0.00 | 0.00 |
| purchase_weekend_share | 0.00 | 0.00 | 0.00 | 0.00 | 0.00 |
| avg_products_cnt | 1.00 | 1.00 | 1.00 | 1.00 | 1.00 |
| avg_delivery_delay_days | -12.24 | -10.27 | -14.03 | -13.09 | -13.05 |
| avg_order_total_weight_kg | 0.85 | 0.70 | 0.89 | 0.80 | 0.75 |
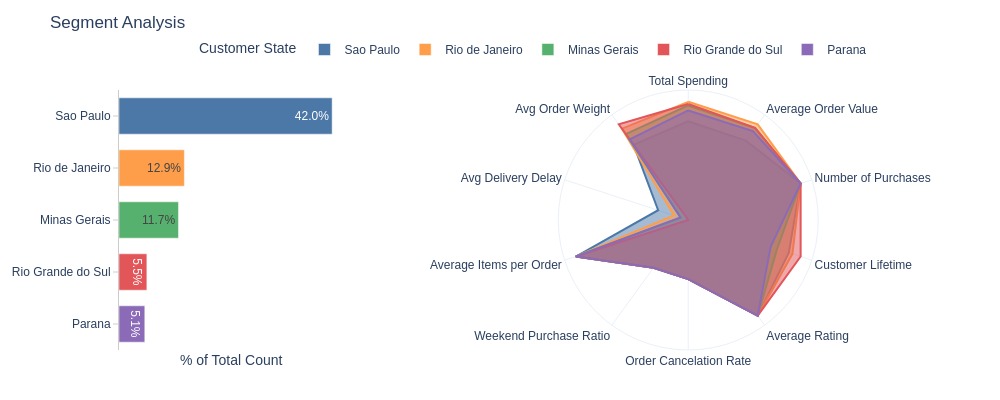
Key Observations:
Customer distribution by state:
São Paulo: 42%
Rio de Janeiro: 13%
Minas Gerais: 12%
By Customer City
fig = df_customers.analysis.segment_polar(
    metrics=selected_metrics
    , dimension='customer_city'
    , exclude_segments=['Never Converted']
    , max_segments=5
    , count_column='customer_unique_id'
    , labels=labels_for_polar
)
pb.to_slide(fig)
df_customers.analysis.segment_table(
    metrics=selected_metrics
    , dimension='customer_city'
    , max_segments=5
    , exclude_segments=['Never Converted']
    , count_column='customer_unique_id'
)
fig.show()
| customer_city | Sao Paulo | Rio De Janeiro | Belo Horizonte | Brasilia | Curitiba |
|---|---|---|---|---|---|
| % of Total Count | 15.60% | 6.87% | 2.78% | 2.15% | 1.52% |
| total_customer_payment | 94.31 | 113.44 | 106.90 | 112.24 | 106.90 |
| avg_total_order_payment | 92.46 | 110.44 | 104.96 | 109.32 | 104.61 |
| buys_cnt | 1.00 | 1.00 | 1.00 | 1.00 | 1.00 |
| from_first_to_last_days | 40.99 | 42.73 | 32.09 | 10.50 | 3.33 |
| customer_avg_reviews_score | 5.00 | 5.00 | 5.00 | 5.00 | 5.00 |
| canceled_share | 0.00 | 0.00 | 0.00 | 0.00 | 0.00 |
| purchase_weekend_share | 0.00 | 0.00 | 0.00 | 0.00 | 0.00 |
| avg_products_cnt | 1.00 | 1.00 | 1.00 | 1.00 | 1.00 |
| avg_delivery_delay_days | -10.04 | -13.05 | -12.26 | -12.05 | -13.05 |
| avg_order_total_weight_kg | 0.65 | 0.85 | 0.74 | 0.60 | 0.70 |
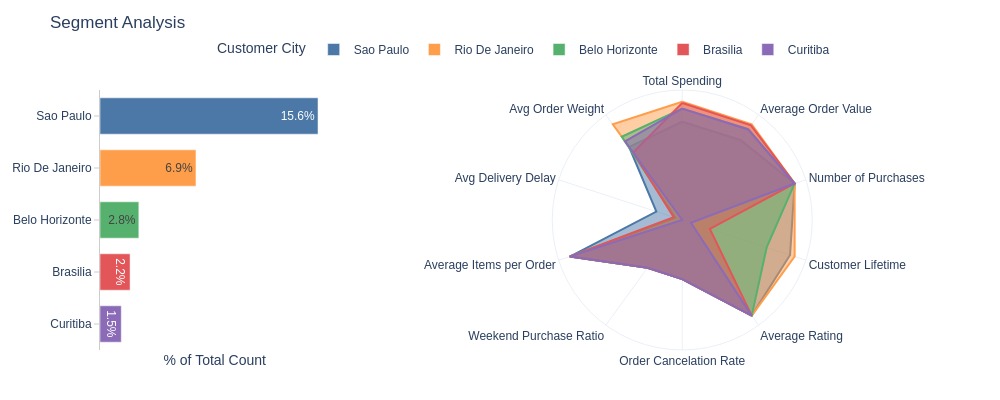
Key Observations:
Customer distribution by city:
São Paulo: 16%
Rio de Janeiro: 7%
Customer Profiling#
By Purchase Frequency & Loyalty
One-Time Buyers (94%):
Single purchase only
Low engagement (short time between purchases)
Potential Core (1%):
Potentially loyal but not yet core
Strong metrics (second only to Core)
Core (<1%):
Loyalty core: highest spending, best metrics
Short-Lived Repeat (1%):
Short-term loyalty
Recommendations:
Convert One-Time to Potential Core:
Launch loyalty programs
Personalized offers based on first purchase
Retain Core customers:
Premium service tier
Exclusive early access to sales
By Payment Amount
High-Spend (24%):
Large orders
Heavy items
Critical risk
Medium-Spend (49%):
Stable base
Balanced metrics
Low-Spend (24%):
Small orders
Likely trial purchases
Recommendations:
For High-Spend:
Improve delivery (current avg. 18 days)
Dedicated account managers
For Low-Spend:
Cross-sell bundles (+15% discount)
“Complete your set” prompts
By Repurchase Timing
Fast Repeat (<1%):
Quick repurchase
Low satisfaction
Seasonal (1%):
Quarterly/semi-annual purchases
High value
Recommendations:
For Fast Repeat:
Post-purchase follow-ups
Satisfaction surveys
For Seasonal:
Pre-season reminders
“Back in stock” alerts
By Loyalty
Promoters (58%):
High ratings (4-5 stars)
Low retention (94% one-time)
Critics (13%):
High spenders
Fast churn
Recommendations:
For Promoters:
“Refer a friend” bonuses
Repeat purchase incentives
For Critics:
Logistics improvements
VIP complaint resolution
Behavioral Patterns
Customers who made purchases not only on weekends (25%):
More loyal (longer time between purchases).
Customers who use installment payments (50%):
Higher order amounts, longer customer lifetime — “serious” customers.
Customers with 2+ products in an order (2%):
Key for revenue (high metrics).
Customers who use only a voucher:
Have lower total purchase amounts and average order amounts.
Recommendations:
Installment campaigns:
“0% interest for 3 months”
Multi-item incentives:
“Free shipping on 3+ items”
Voucher users:
Upsell to credit card payments
By Geographic
São Paulo (42%):
Electronics/Furniture focus
18% faster delivery than average
Rio de Janeiro (13%):
High Fashion/Beauty demand
22% installment adoption
Recommendations:
Localized campaigns:
“SP Furniture Week” discounts
“Rio Beauty Box” bundles
Warehouse optimization:
Strategic stock placement
Regional delivery hubs
Pairwise Segment Combinations#
Examine the distribution of customers across combinations of 2 segments.
We will exclude the non-converted segment from the analysis.
pb.configure(
    df = df_customers[df_customers.buys_cnt.notna()]
    , metric = 'customer_unique_id'
    , metric_label = 'Share of Customers'
    , agg_func = 'nunique'
    , norm_by='all'
    , axis_sort_order='descending'
    , text_auto='.1%'
)
loyalty_segment and value_segment
pb.cat_compare(
    cat1='loyalty_segment'
    , cat2 = 'value_segment'
    , visible_graphs = [2, 3]
)
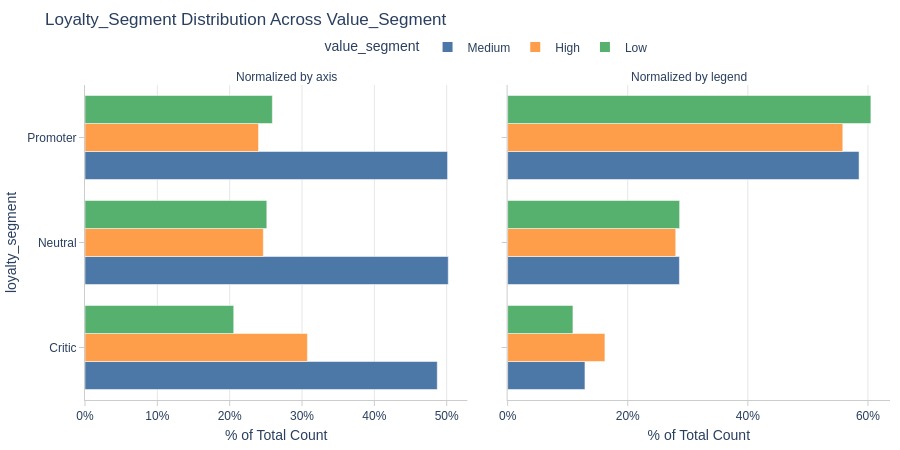
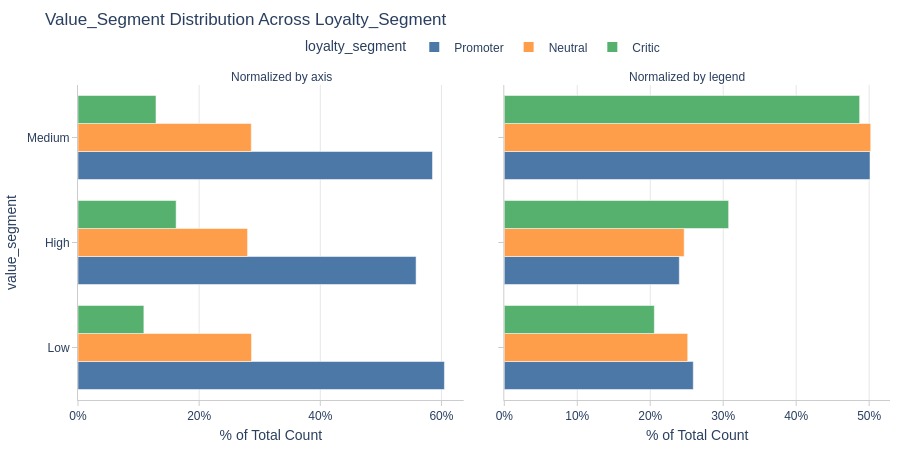
Key Observations:
The medium payment tier dominates across all loyalty segments.
Promoters are the majority in all payment tiers.
Critics stand out noticeably in the high payment tier segment.
purchase_freq_segment and value_segment
pb.cat_compare(
    cat1='purchase_freq_segment'
    , cat2 = 'value_segment'
    , visible_graphs = [2, 3]
)
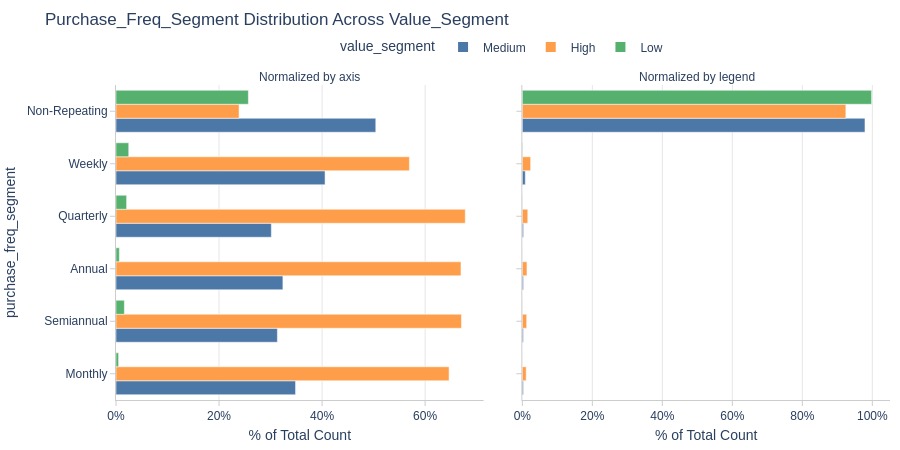
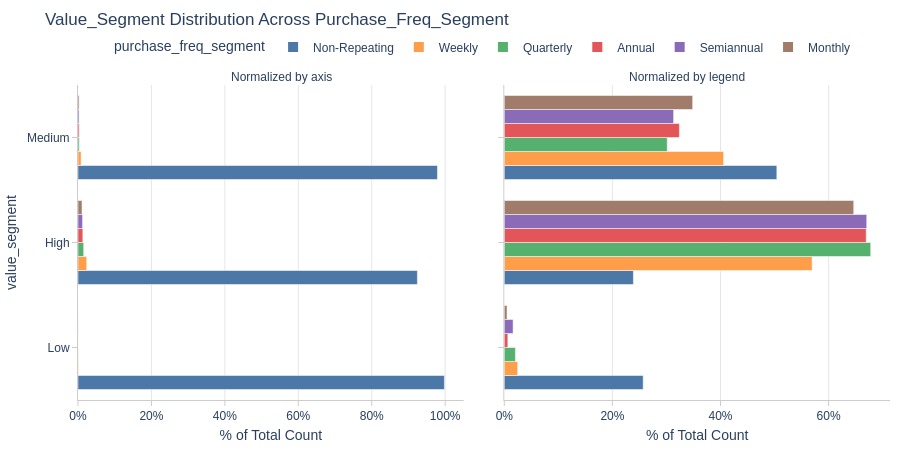
Key Observations:
The low Value segment has a significantly higher proportion of non-repeat purchasers (logical since they don’t make repeat purchases).
In the high Value segment, the weekly purchase frequency segment underperforms - meaning fewer purchases occurred weekly.
activity_segment and repeat_segment
pb.cat_compare(
    cat1='activity_segment'
    , cat2 = 'repeat_segment'
    , visible_graphs = [2, 3]
)
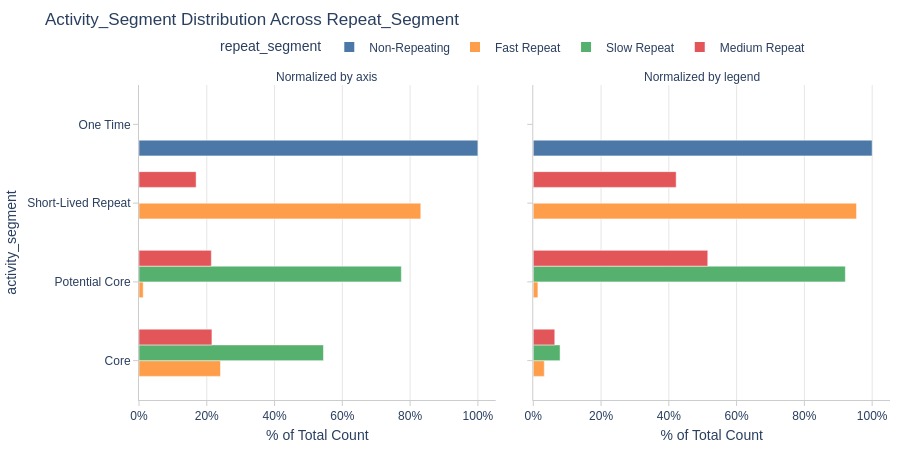
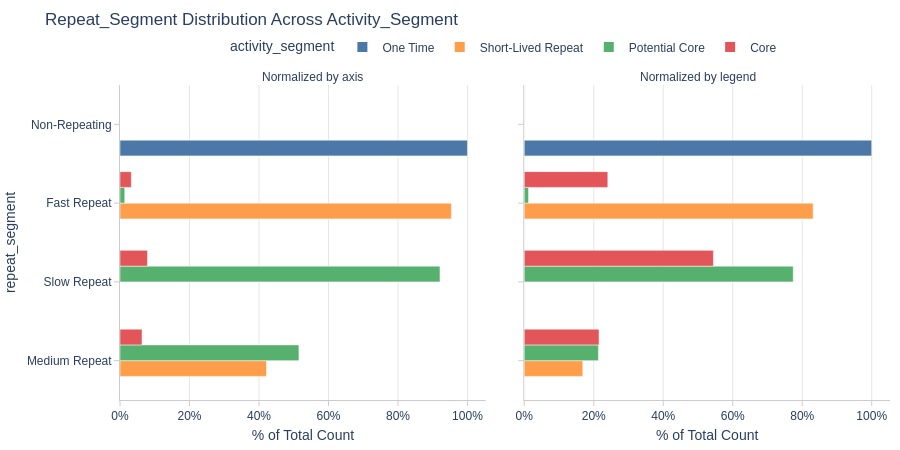
Key Observations:
The slow repeat segment is clearly highlighted in potential core, meaning they have a long time between repeat purchases. The same pattern is present in the core segment, but it is less pronounced.
loyalty_segment and risk_segment
pb.cat_compare(
    cat1='loyalty_segment'
    , cat2 = 'risk_segment'
    , visible_graphs = [2, 3]
)
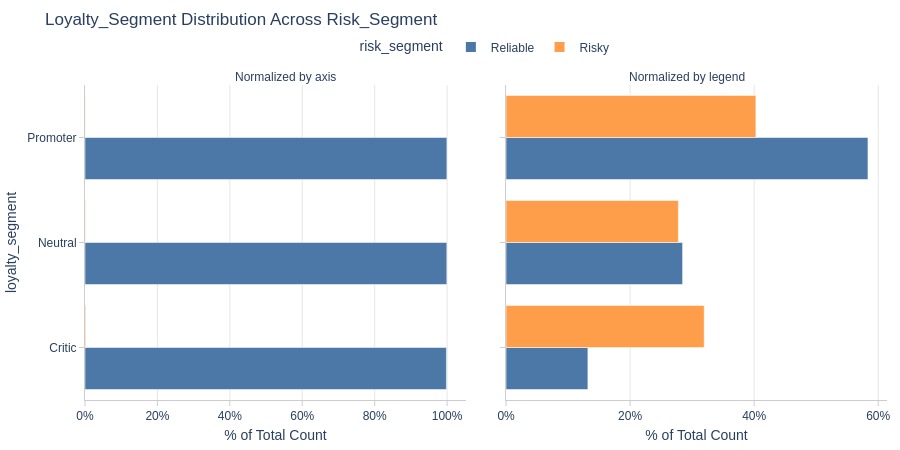
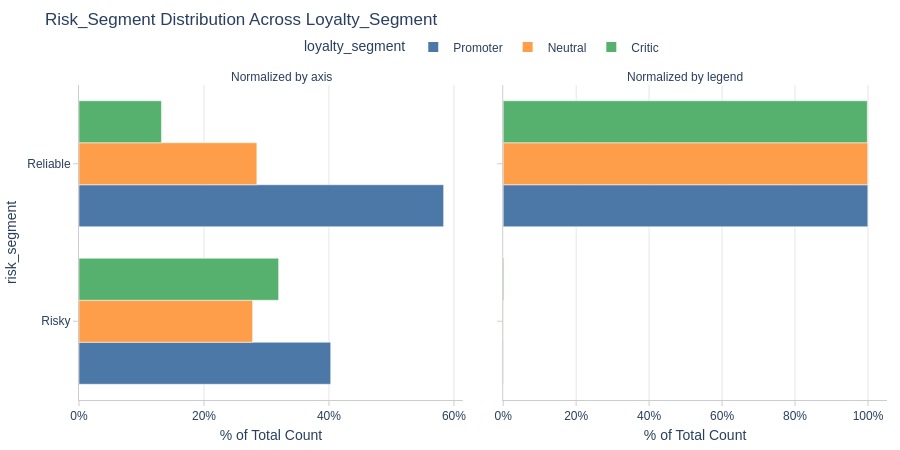
Key Observations:
The potential core cohort clearly highlights the slow repeat segment, indicating a longer time period before repeat purchases. In the core cohort, the same pattern is observed, but it is less pronounced.
customer_top_general_product_categories and value_segment
pb.cat_compare(
    cat1='customer_top_general_product_categories'
    , cat2 = 'value_segment'
    , trim_top_n_cat1=5
    , visible_graphs = [2, 3]
)
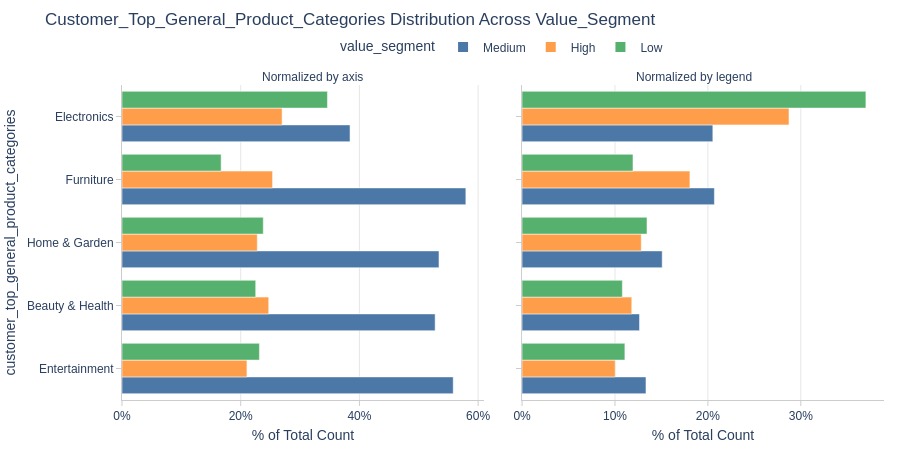
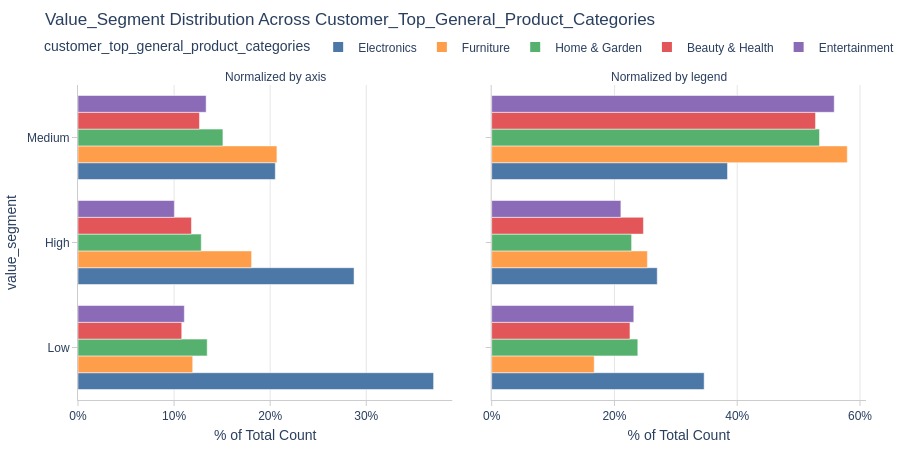
Key Observations:
Electronics dominate purchases in the low Value segment, while medium Value segments show noticeably fewer electronics purchases.
weight_segment and customer_state
pb.cat_compare(
    cat1='weight_segment'
    , cat2 = 'customer_state'
    , trim_top_n_cat2=5
    , visible_graphs = [2, 3]
)
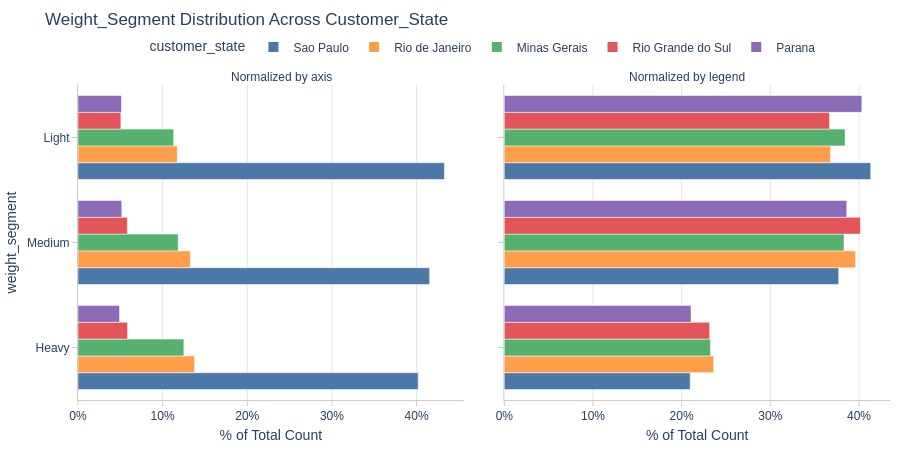
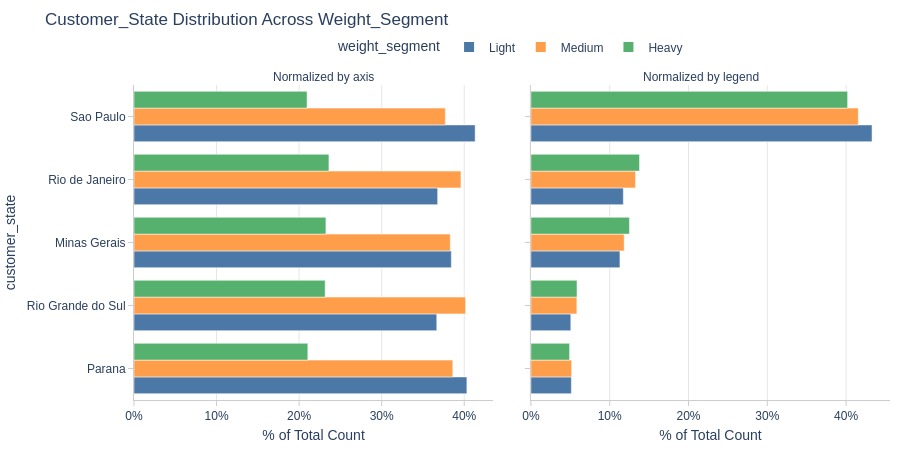
Key Observations:
São Paulo has more light-weight orders while Rio de Janeiro has more heavy-weight orders.
weekday_segment and activity_segment
pb.cat_compare(
    cat1='weekday_segment'
    , cat2 = 'activity_segment'
    , visible_graphs = [2, 3]
)
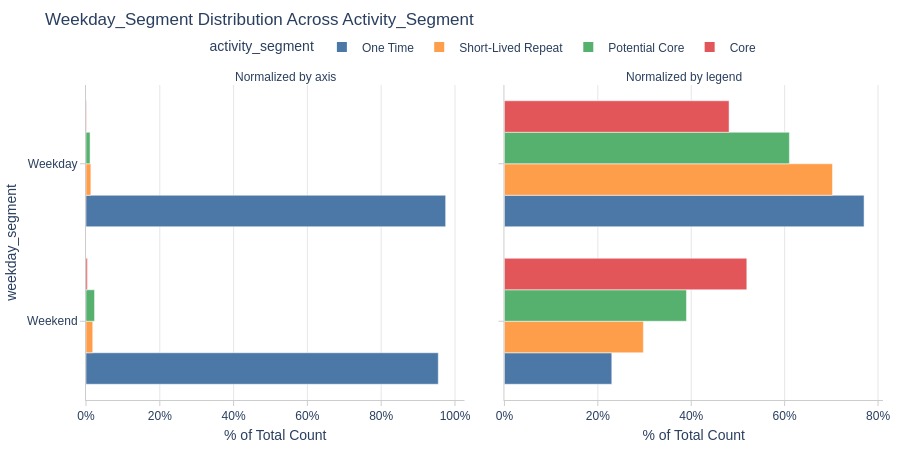
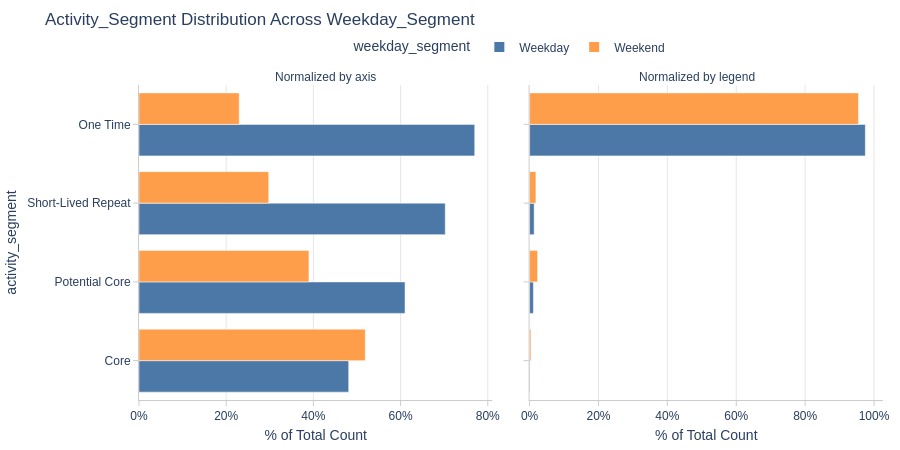
Key Observations:
Core and potential core segments contain more customers who shop beyond just weekdays, while one-time purchasers predominantly shop on weekdays.
products_cnt_segment and loyalty_segment
pb.cat_compare(
    cat1='products_cnt_segment'
    , cat2 = 'loyalty_segment'
    , visible_graphs = [2, 3]
)
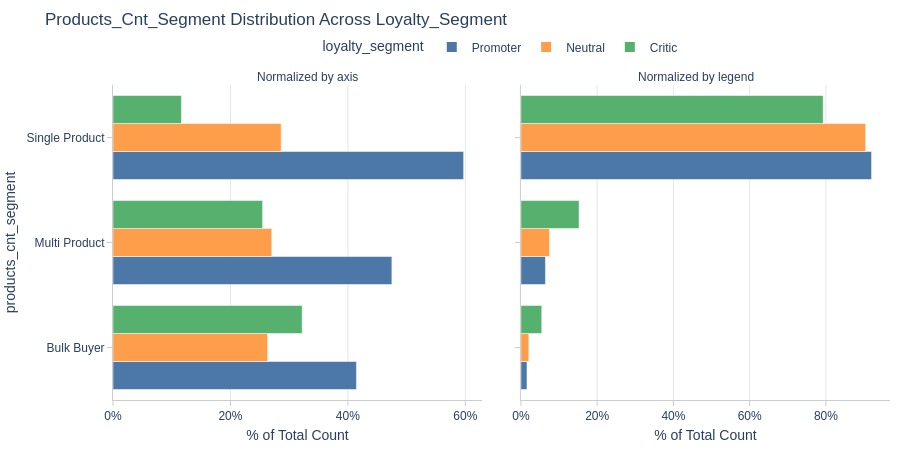
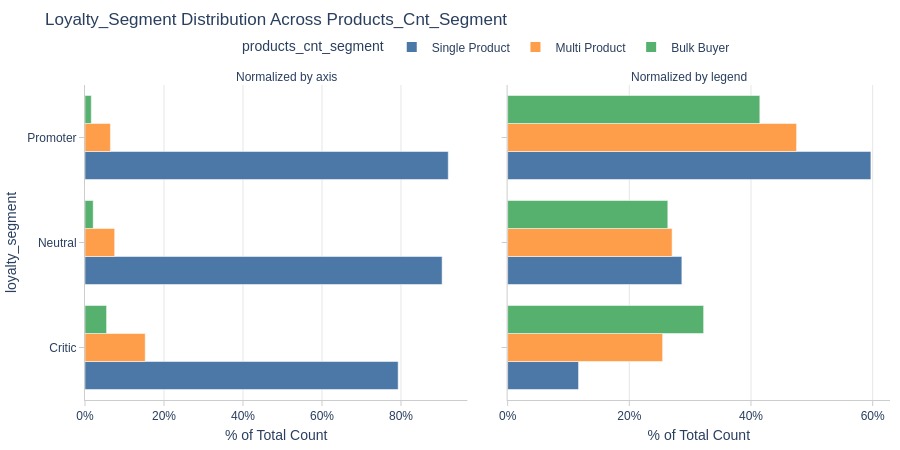
Key Observations:
Single-product orders dominate among promoters, while critics tend to have more 2+ product orders.
installment_segment and repeat_segment
pb.cat_compare(
    cat1='installment_segment'
    , cat2 = 'repeat_segment'
    , visible_graphs = [2, 3]
)
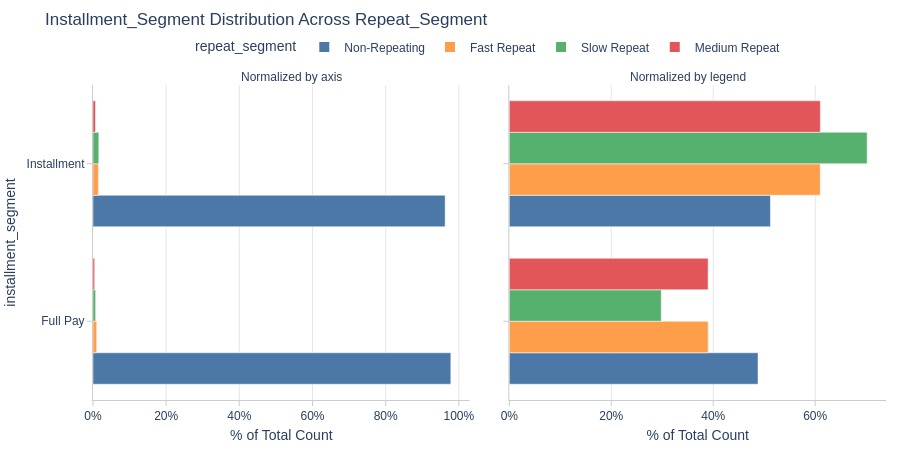
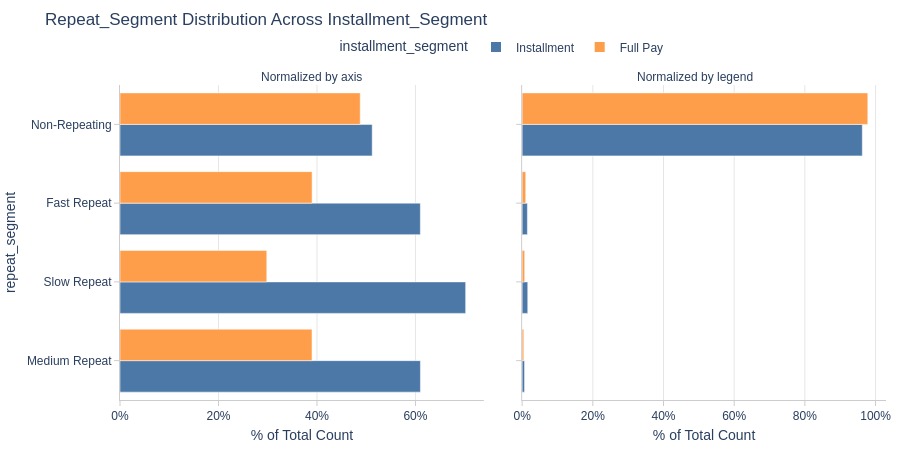
Key Observations:
The installment segment contains more customers with longer periods between repeat purchases.
The non-installment segment shows:
Lower proportion of long repeat purchase cycles
Dominance of one-time purchasers