Cohort Analysis#
We will analyze different metrics by monthly cohorts.
We will choose a period of 30 days for lifetime, meaning each 30 days, the cohort’s lifetime will increase by 1.
Number of Sales
fig = df_sales.analysis.cohort(
    mode='sales'
    , user_id_col='customer_unique_id'
    , date_col='order_purchase_dt'
    , order_id_col='order_id'
)
pb.to_slide(fig)
fig.show()
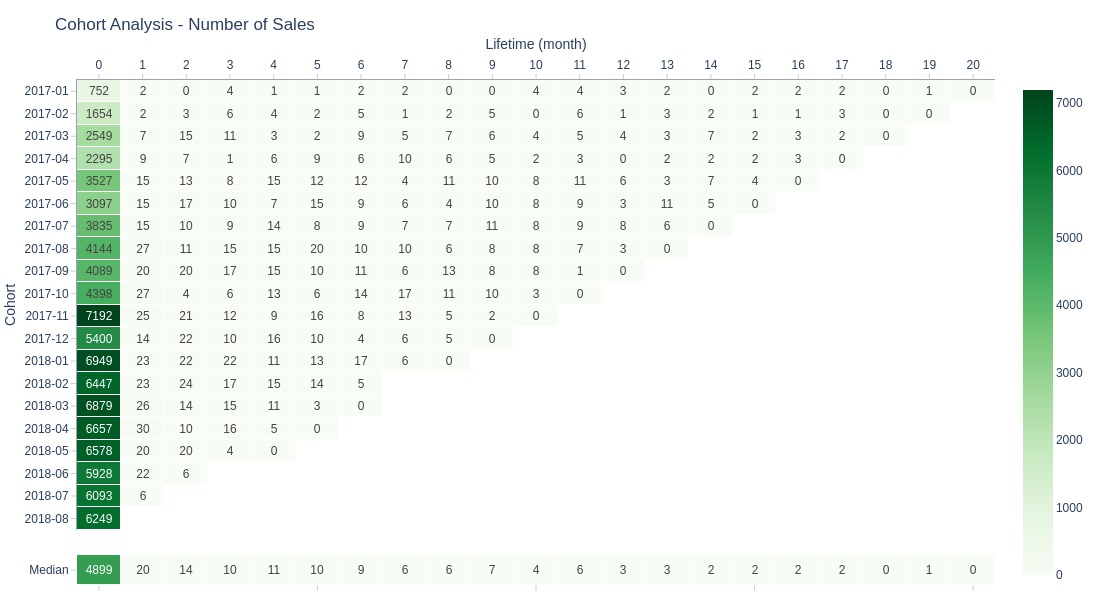
Key Observations:
Most purchases occur in the cohort’s first month
Stabilization after first month without sharp decline
Revenue
Since Olist is a marketplace, it is reasonable to calculate revenue by the total amount of sold products. This is because the revenue for marketplaces typically comes from commissions on sellers.
fig = df_sales.analysis.cohort(
    mode='revenue'
    , user_id_col='customer_unique_id'
    , date_col='order_purchase_dt'
    , order_id_col='order_id'
    , revenue_col='total_products_price'
    , text_auto='.2s'
)
pb.to_slide(fig)
fig.show()
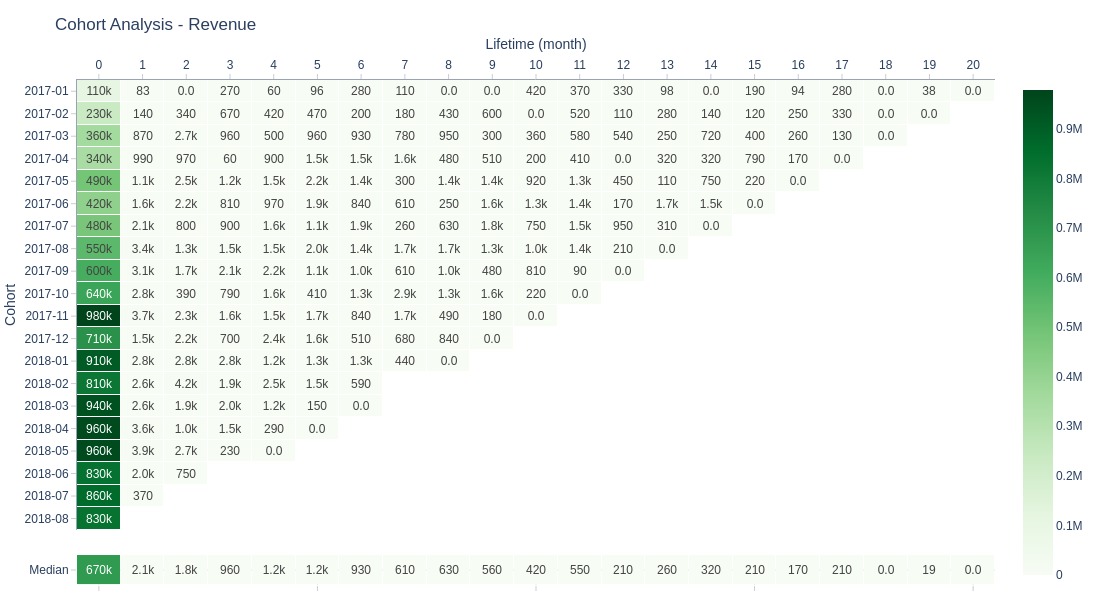
Key Observations:
Revenue follows similar pattern to sales volume
Majority of cohort revenue generated in first month
No sharp lifetime decline observed
Average Order Value
For calculating the average order value, it is reasonable to take the total payment amount per order. This is because the average order value should reflect the total cost of the order.
fig = df_sales.analysis.cohort(
    mode='aov'
    , user_id_col='customer_unique_id'
    , date_col='order_purchase_dt'
    , order_id_col='order_id'
    , revenue_col='total_payment'
)
pb.to_slide(fig)
fig.show()
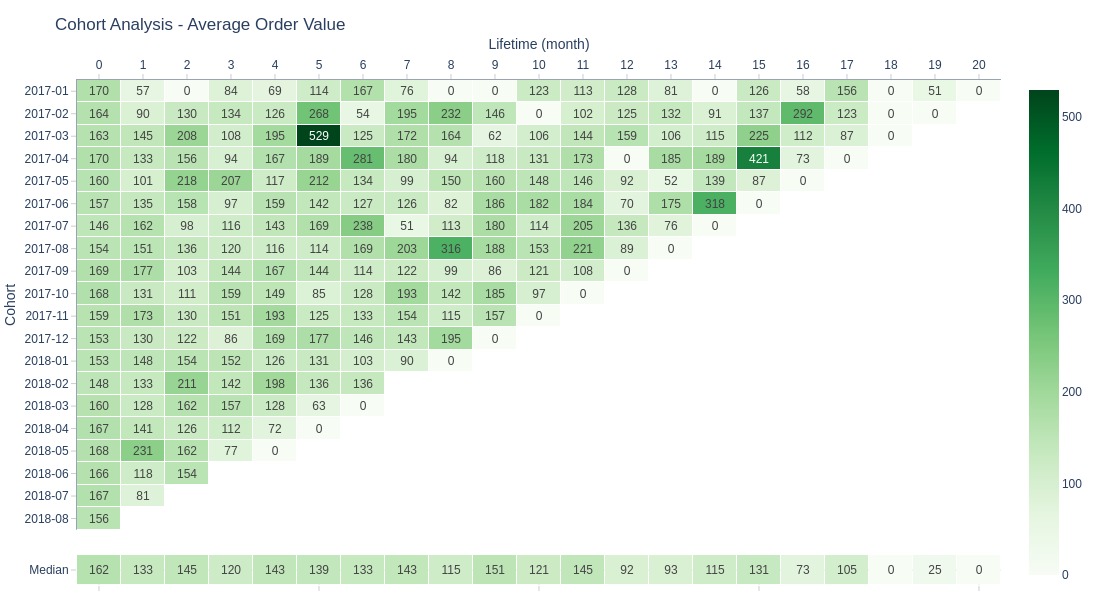
Key Observations:
No post-first-month decline in average order value (relative metric)
No clear growth/decline trend across cohort lifetimes
Some peak values in isolated periods
Median AOV shows slight decline after 11 months
Anomalously high AOV:
March 2017 cohort (month 5)
April 2017 cohort (month 15)
Number of Buyers
fig = df_sales.analysis.cohort(
    mode='buyers'
    , user_id_col='customer_unique_id'
    , date_col='order_purchase_dt'
    , order_id_col='order_id'
)
pb.to_slide(fig)
fig.show()
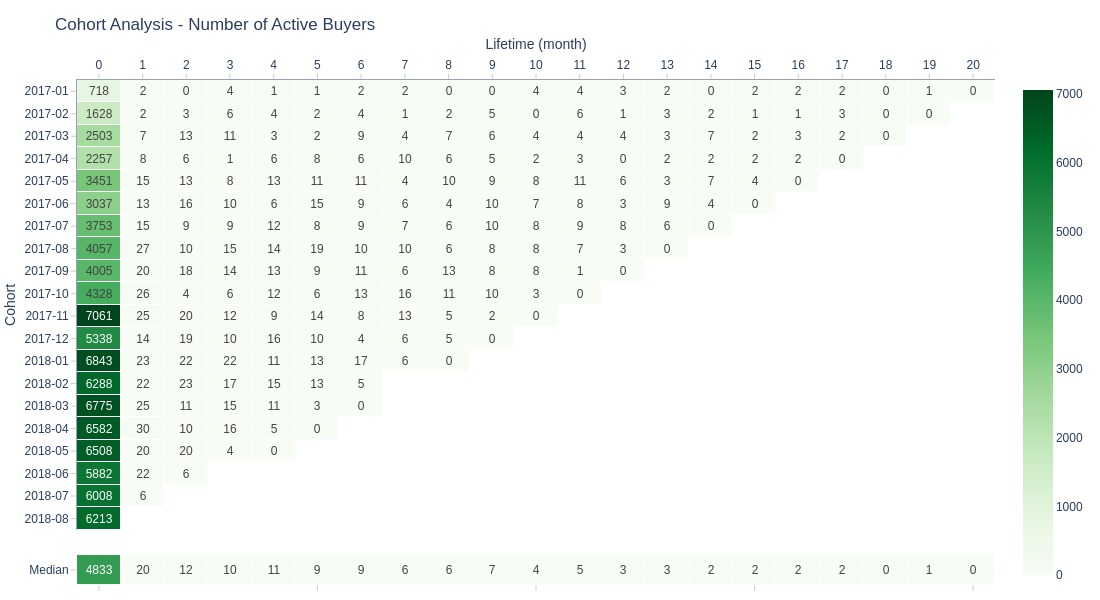
Key Observations:
Customer count pattern mirrors revenue/sales
Nearly all customers don’t return after first month
Retention
fig = df_sales.analysis.cohort(
    mode='retention'
    , user_id_col='customer_unique_id'
    , date_col='order_purchase_dt'
    , order_id_col='order_id'
    , include_period0=False
)
pb.to_slide(fig)
fig.show()
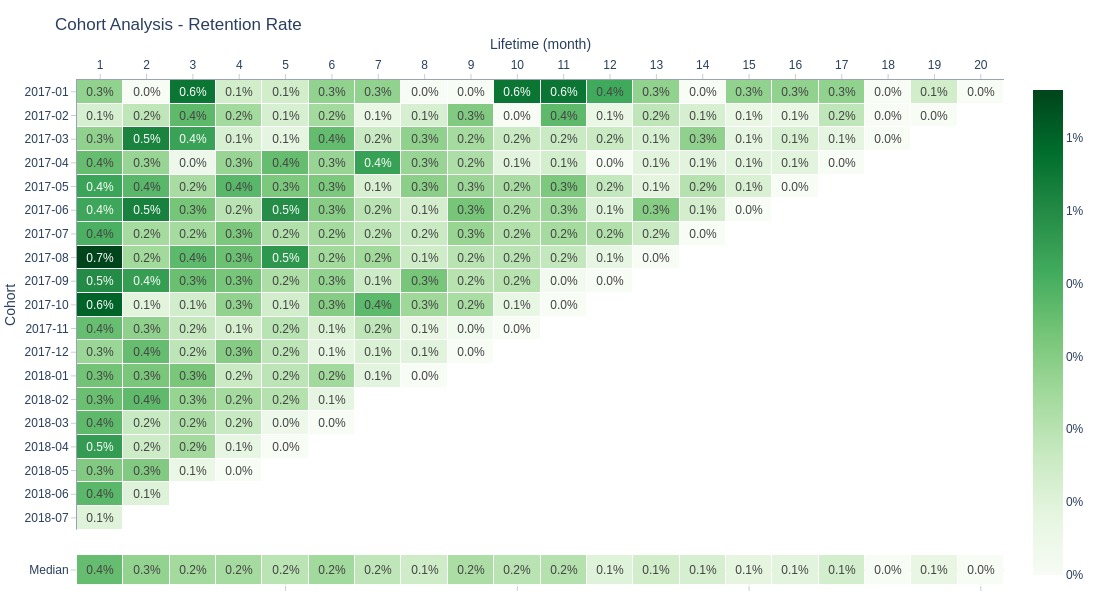
Key Observations:
Extremely low 1st+ month retention
Olist shows very poor customer retention
Let’s look at the median retention of cohorts by periods.
fig = df_sales.analysis.cohort(
    mode='retention'
    , user_id_col='customer_unique_id'
    , date_col='order_purchase_dt'
    , order_id_col='order_id'
    , display_mode='summary'
)
pb.to_slide(fig)
fig.show()
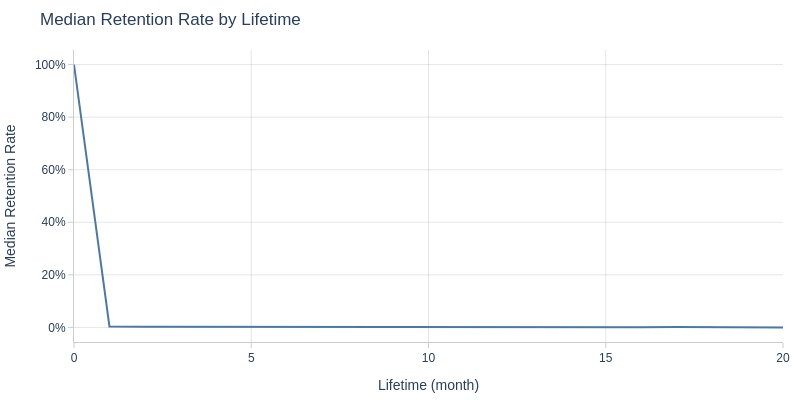
Key Observations:
Clear pattern: minimal customers return for repeat purchases
Average Payment Count
fig = df_sales.analysis.cohort(
    mode='apc'
    , user_id_col='customer_unique_id'
    , date_col='order_purchase_dt'
    , order_id_col='order_id'
)
pb.to_slide(fig)
fig.show()
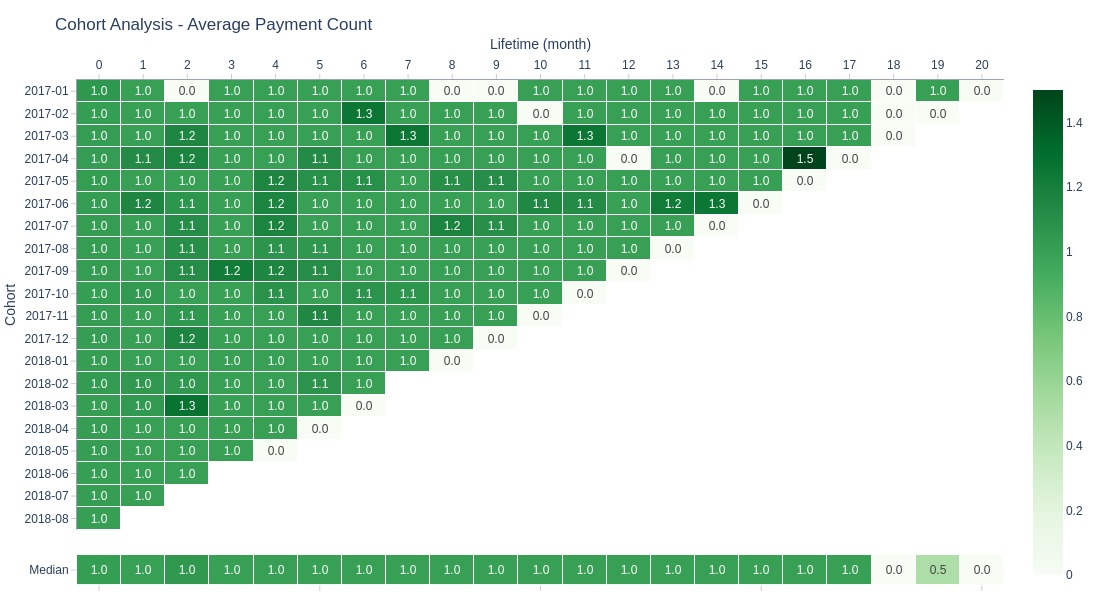
Key Observations:
Customers typically make 1-1.3 purchases per period
ARPPU
For ARPPU, it is reasonable to take the total cost of products in the order, as we need the revenue per customer.
fig = df_sales.analysis.cohort(
    mode='arppu'
    , user_id_col='customer_unique_id'
    , date_col='order_purchase_dt'
    , order_id_col='order_id'
    , revenue_col='total_products_price'
)
pb.to_slide(fig)
fig.show()
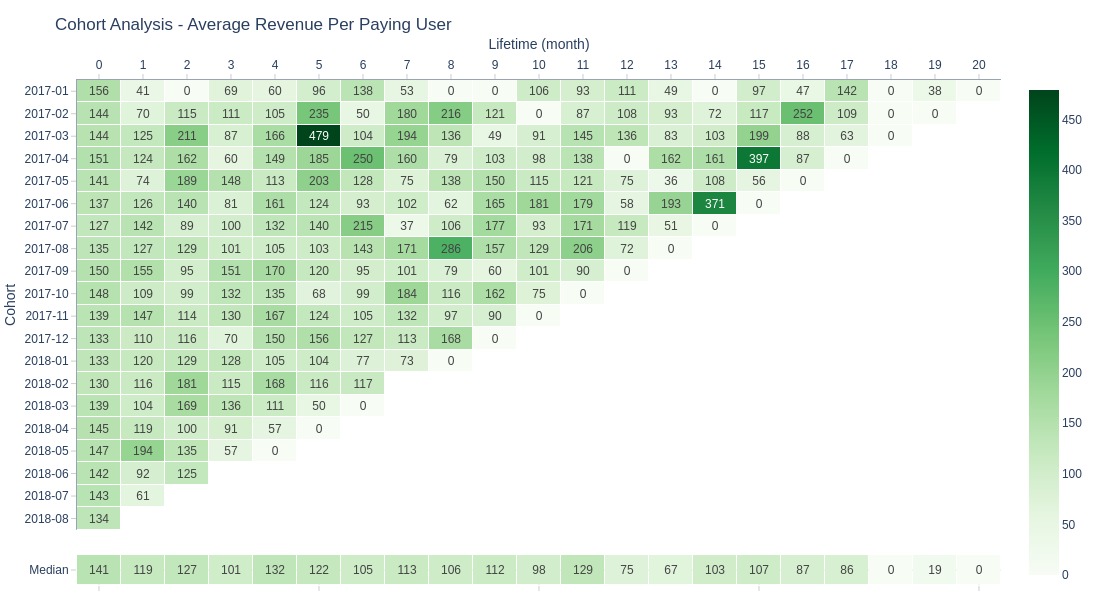
Key Observations:
Pattern similar to average order value
ARPPU resembles AOV since most customers make single purchases
LTV (Revenue-Based)
Since we do not have data on expenses or the margin coefficient, we cannot calculate the actual LTV.
We will calculate LTV (Revenue-Based), assuming a margin coefficient of 1. This will serve as a proxy for LTV.
fig = df_sales.analysis.cohort(
    mode='ltv'
    , user_id_col='customer_unique_id'
    , date_col='order_purchase_dt'
    , order_id_col='order_id'
    , margin=1
)
pb.to_slide(fig)
fig.show()
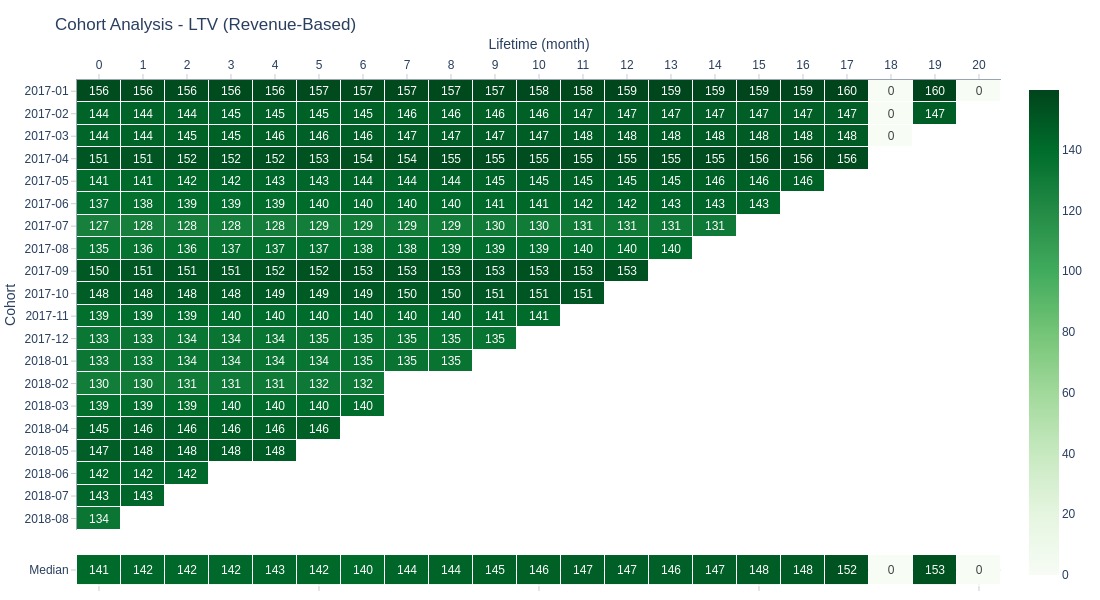
Key Observations:
Revenue-Based LTV remains stable across lifetime periods
Expected pattern since most purchases occur in first month
LTV reflects cumulative lifetime performance
