Review Analysis#
Number of Reviews#
pb.configure(
    df = df_reviews
    , time_column = 'review_creation_dt'
    , metric = 'review_id'
    , metric_label = 'Share of Reviews'
    , metric_label_for_distribution = 'Number of Reviews'
    , agg_func = 'nunique'
    , norm_by='all'
    , axis_sort_order='descending'
    , text_auto='.1%'
    , update_fig={'xaxis': {'tickformat': '.0%'}}
)
print(f'Total number of reviews: {df_reviews.review_id.nunique():,}')
Total number of reviews: 98,838
Let’s see at statistics and distribution of the metric.
pb.metric_info(freq='D')
| Summary | Percentiles | Detailed Stats | Value Counts | |||||||
|---|---|---|---|---|---|---|---|---|---|---|
| Total | 597 (100%) | Max | 464 | Mean | 165.56 | 1 | 16 (3%) | |||
| Missing | --- | 99% | 419.20 | Trimmed Mean (10%) | 159.12 | 0 | 14 (2%) | |||
| Distinct | 303 (51%) | 95% | 374.20 | Mode | 1 | 5 | 8 (1%) | |||
| Non-Duplicate | 143 (24%) | 75% | 269 | Range | 464 | 9 | 7 (1%) | |||
| Duplicates | 294 (49%) | 50% | 154 | IQR | 220 | 17 | 7 (1%) | |||
| Dup. Values | 160 (27%) | 25% | 49 | Std | 124.62 | 192 | 6 (1%) | |||
| Zeros | 14 (2%) | 5% | 1.80 | MAD | 161.60 | 8 | 6 (1%) | |||
| Negative | --- | 1% | 0 | Kurt | -1.07 | 2 | 6 (1%) | |||
| Memory Usage | <1 Mb | Min | 0 | Skew | 0.33 | 4 | 6 (1%) | |||
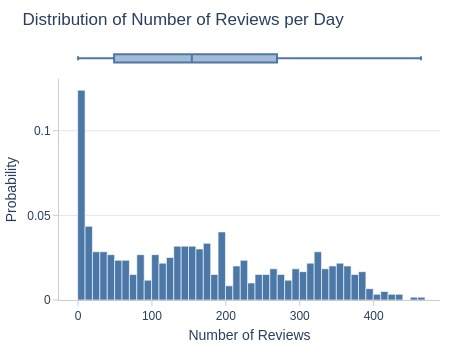
Key Observations:
Typical day: 1 review created
75% of days had ≤270 reviews
Top 5% ≥375 reviews
Let’s look by different dimensions.
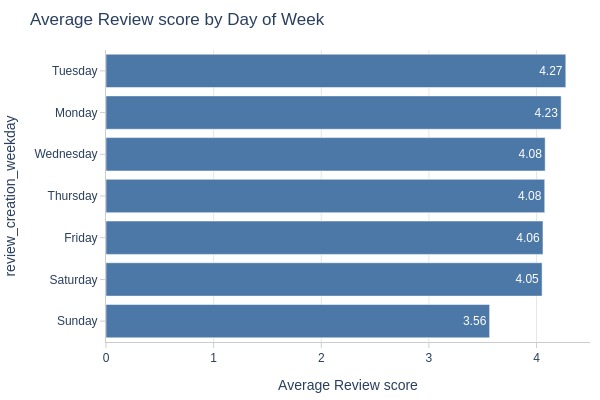
By Day of Week
pb.bar_groupby(y='review_creation_weekday', to_slide=True)
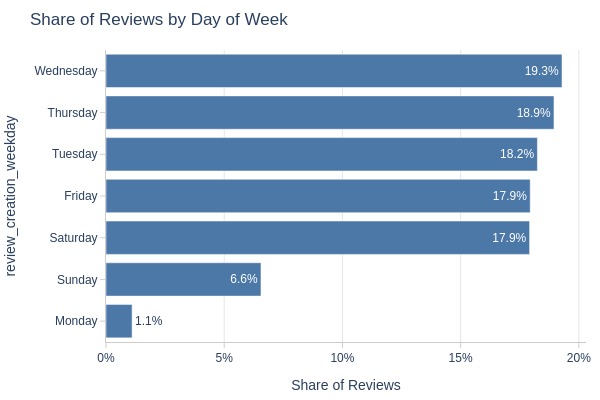
Key Observations:
Fewest reviews on Mondays
Sundays slightly more than Mondays but still low
Possible review registration pattern
By Day Type
pb.bar_groupby(y='review_day_type')
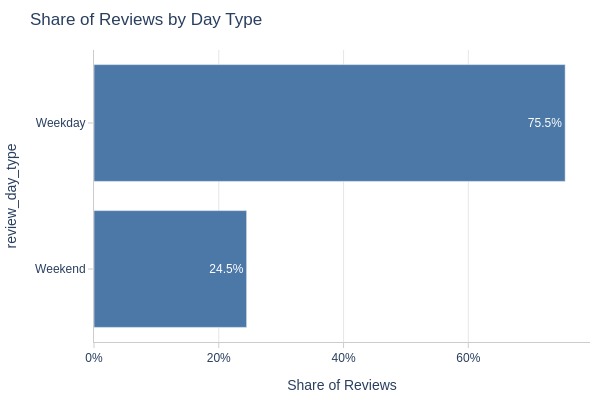
Key Observations:
76% of reviews created on weekdays
Matches fewer weekend days
By Review Score
pb.bar_groupby(y='review_score', to_slide=True)
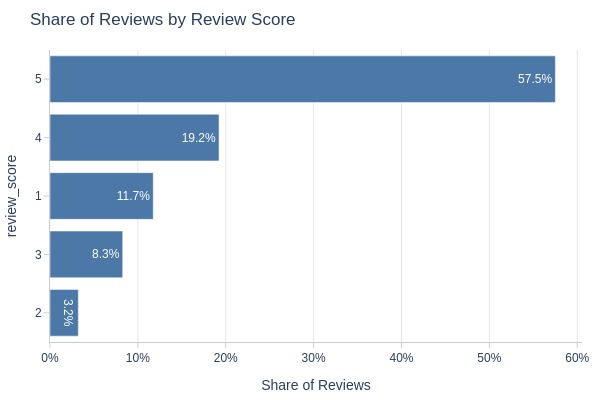
Key Observations:
Review score distribution:
5 stars: 58%
4 stars: 19%
1 star: 12%
3 stars: 8%
2 stars: 3%
Review score#
pb.configure(
    df = df_reviews
    , time_column = 'review_creation_dt'
    , metric = 'review_score'
    , metric_label = 'Average Review score'
    , agg_func = 'mean'
    , axis_sort_order='descending'
    , text_auto='.3s'
)
print(f'Average Review score: {df_reviews.review_score.mean():.2f}')
Average Review score: 4.07
Let’s see at statistics and distribution of the metric.
pb.metric_info(
    labels=dict(review_score='Review score')
    , title='Distribution of Review score'
    , xaxis_type='category'
)
| Summary | Percentiles | Detailed Stats | Value Counts | |||||||
|---|---|---|---|---|---|---|---|---|---|---|
| Total | 99.65k (100%) | Max | 5 | Mean | 4.07 | 5 | 57.26k (57%) | |||
| Missing | --- | 99% | 5 | Trimmed Mean (10%) | 4.34 | 4 | 19.15k (19%) | |||
| Distinct | 5 (<1%) | 95% | 5 | Mode | 5 | 1 | 11.75k (12%) | |||
| Non-Duplicate | 0 (<1%) | 75% | 5 | Range | 4 | 3 | 8.26k (8%) | |||
| Duplicates | 99.64k (99%) | 50% | 5 | IQR | 1 | 2 | 3.22k (3%) | |||
| Dup. Values | 5 (<1%) | 25% | 4 | Std | 1.36 | |||||
| Zeros | --- | 5% | 1 | MAD | 0 | |||||
| Negative | --- | 1% | 1 | Kurt | 0.43 | |||||
| Memory Usage | 1 | Min | 1 | Skew | -1.34 | |||||
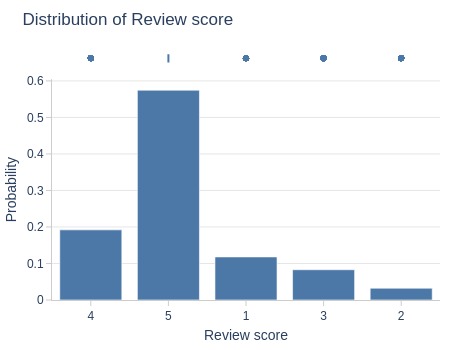
Key Observations:
58% of reviews had score 5.
Let’s see at statistics and distribution of the metric per day.
pb.metric_info(freq='D')
| Summary | Percentiles | Detailed Stats | Value Counts | |||||||
|---|---|---|---|---|---|---|---|---|---|---|
| Total | 583 (98%) | Max | 5 | Mean | 4.05 | 5 | 17 (3%) | |||
| Missing | 14 (2%) | 99% | 5 | Trimmed Mean (10%) | 4.09 | 4 | 15 (3%) | |||
| Distinct | 511 (86%) | 95% | 4.60 | Mode | 5 | 4.25 | 5 (<1%) | |||
| Non-Duplicate | 479 (80%) | 75% | 4.26 | Range | 4 | 4.60 | 3 (<1%) | |||
| Duplicates | 85 (14%) | 50% | 4.14 | IQR | 0.35 | 3.50 | 3 (<1%) | |||
| Dup. Values | 32 (5%) | 25% | 3.92 | Std | 0.43 | 3 | 3 (<1%) | |||
| Zeros | --- | 5% | 3.26 | MAD | 0.23 | 3.75 | 3 (<1%) | |||
| Negative | --- | 1% | 2.70 | Kurt | 7.18 | 4.33 | 3 (<1%) | |||
| Memory Usage | <1 Mb | Min | 1 | Skew | -1.61 | 4.67 | 3 (<1%) | |||
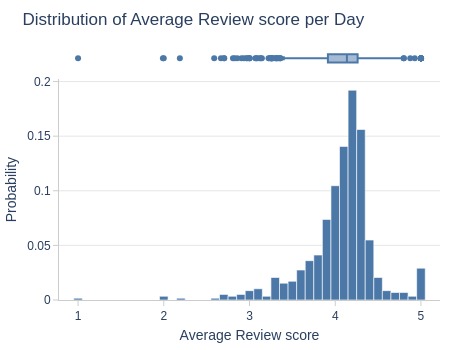
Key Observations:
Daily average ratings:
Bottom 5% <3.26
Middle 50% 3.9-4.3
Top 5% >4.6
Let’s look by different dimensions.
By Day Type
pb.cat_compare(cat2='review_day_type'
            , visible_graphs=[2]
)
pb.bar_groupby(y='review_day_type').show()
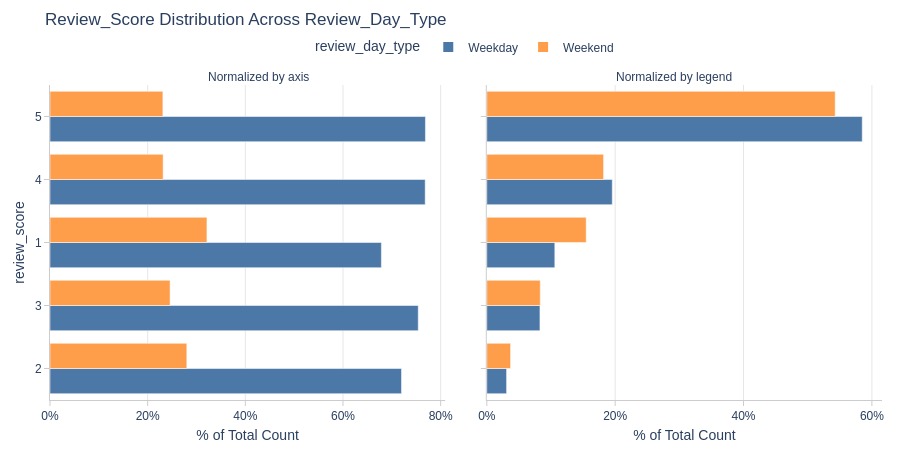
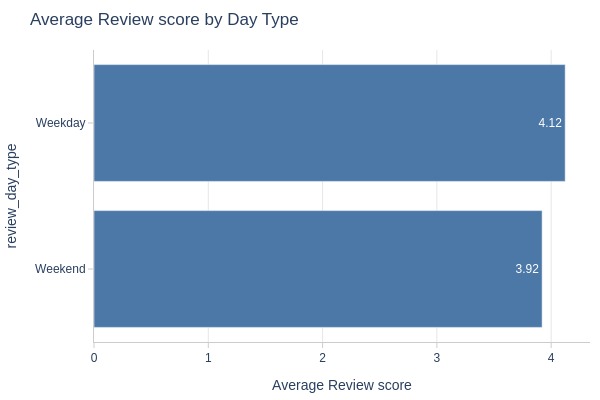
Key Observations:
Weekdays have slightly higher ratings
More 5-star reviews weekdays
More 1-star reviews weekends
By Day of Week
pb.cat_compare(cat2='review_creation_weekday'
            , visible_graphs=[2]
)
pb.bar_groupby(y='review_creation_weekday').show()
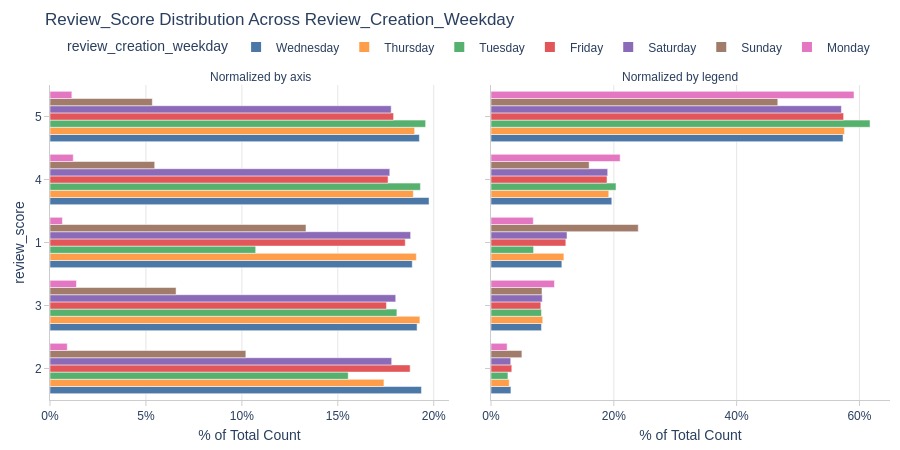
Key Observations:
Sundays have lowest ratings
Highest 1-star share on Sundays
Lowest 5-star share on Sundays
Review Answer Time#
pb.configure(
    df = df_reviews
    , time_column = 'review_creation_dt'
    , metric = 'review_answer_time_days'
    , metric_label = 'Average Review Answer Time, days'
    , metric_label_for_distribution = 'Review Answer Time, days'
    , agg_func = 'mean'
    , axis_sort_order='descending'
    , text_auto='.3s'
)
print(f'Average Review Answer Time: {df_reviews.review_answer_time_days.mean():.2f} days')
Average Review Answer Time: 3.13 days
Let’s see at statistics and distribution of the metric.
pb.metric_info(
    upper_quantile=0.95
    , hist_mode='dual_hist_trim'
)
| Summary | Percentiles | Detailed Stats | Value Counts | |||||||
|---|---|---|---|---|---|---|---|---|---|---|
| Total | 99.65k (100%) | Max | 518.70 | Mean | 3.13 | 1.03 | 7 (<1%) | |||
| Missing | --- | 99% | 21.95 | Trimmed Mean (10%) | 2.08 | 1.05 | 7 (<1%) | |||
| Distinct | 82.39k (83%) | 95% | 6.96 | Mode | Multiple | 0.96 | 6 (<1%) | |||
| Non-Duplicate | 68.47k (69%) | 75% | 3.10 | Range | 518.61 | 0.97 | 6 (<1%) | |||
| Duplicates | 17.26k (17%) | 50% | 1.67 | IQR | 2.10 | 1.05 | 6 (<1%) | |||
| Dup. Values | 13.92k (14%) | 25% | 1.00 | Std | 9.75 | 0.96 | 6 (<1%) | |||
| Zeros | --- | 5% | 0.62 | MAD | 1.29 | 0.97 | 6 (<1%) | |||
| Negative | --- | 1% | 0.38 | Kurt | 792.26 | 0.98 | 6 (<1%) | |||
| Memory Usage | 1 | Min | 0.09 | Skew | 23.69 | 3.47 | 6 (<1%) | |||
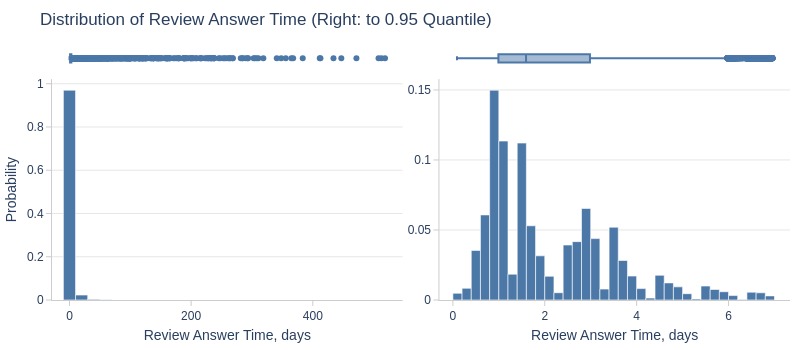
Key Observations:
Review response time bimodal: ~1 day and ~3.5 days
75% responded within 3.1 days
Top 5% took ≥7 days
Let’s see at statistics and distribution of the metric per day.
pb.metric_info(freq='D')
| Summary | Percentiles | Detailed Stats | Value Counts | |||||||
|---|---|---|---|---|---|---|---|---|---|---|
| Total | 583 (98%) | Max | 22.62 | Mean | 3.18 | 1.85 | 1 (<1%) | |||
| Missing | 14 (2%) | 99% | 8.11 | Trimmed Mean (10%) | 2.96 | 2.52 | 1 (<1%) | |||
| Distinct | 583 (98%) | 95% | 5.85 | Mode | Multiple | 2.66 | 1 (<1%) | |||
| Non-Duplicate | 583 (98%) | 75% | 3.48 | Range | 22.24 | 3.51 | 1 (<1%) | |||
| Duplicates | 13 (2%) | 50% | 2.86 | IQR | 0.99 | 3.30 | 1 (<1%) | |||
| Dup. Values | 0 (<1%) | 25% | 2.49 | Std | 1.68 | 2.05 | 1 (<1%) | |||
| Zeros | --- | 5% | 1.67 | MAD | 0.66 | 1.91 | 1 (<1%) | |||
| Negative | --- | 1% | 0.90 | Kurt | 50.02 | 3.64 | 1 (<1%) | |||
| Memory Usage | <1 Mb | Min | 0.38 | Skew | 5.50 | 2.18 | 1 (<1%) | |||
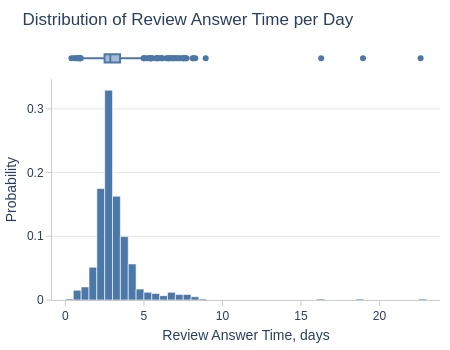
Key Observations:
5% of review days had average response time ≥5.85 days
Let’s look by different dimensions.
By Day of Week
pb.histogram(color='review_creation_weekday').show()
pb.bar_groupby(y='review_creation_weekday').show()
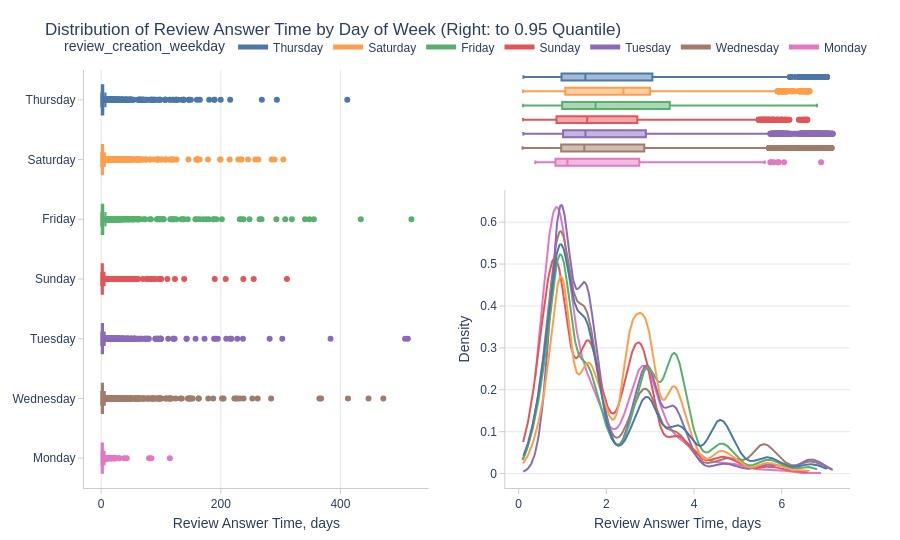
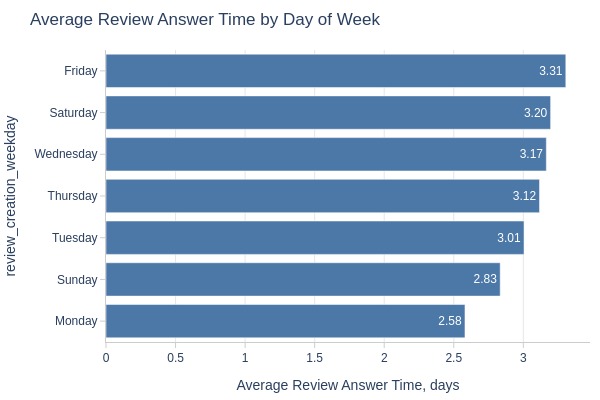
Key Observations:
Slowest responses to Friday reviews
Fastest responses to Monday reviews
NPS#
For calculating NPS, we will divide customers into the following groups:
Promoters: customers who gave a rating of 5
Passive: customers who gave a rating of 4
Detractors: customers who gave a rating of 1-3
Let’s look at how NPS changed by month.
tmp_df_res = (
    df_reviews.pivot_table(index=pd.Grouper(key='review_creation_dt', freq='D'), columns='review_score', values='review_id', aggfunc='nunique')
)
tmp_df_res['total_responses'] = tmp_df_res.sum(axis=1)
tmp_df_res['promoters'] = tmp_df_res[5]
tmp_df_res['detractors'] = tmp_df_res[1] + tmp_df_res[2] + tmp_df_res[3]
tmp_df_res['nps'] = (tmp_df_res['promoters'] - tmp_df_res['detractors']) * 100 / tmp_df_res['total_responses']
tmp_df_res.reset_index(inplace=True)
Let’s see at statistics and distribution of the metric per day.
tmp_df_res['nps'].explore.info(
    labels=dict(nps='NPS per Day')
    , title='Distribution of NPS per Day'
)
| Summary | Percentiles | Detailed Stats | Value Counts | |||||||
|---|---|---|---|---|---|---|---|---|---|---|
| Total | 476 (82%) | Max | 70.97 | Mean | 31.54 | 0 | 7 (1%) | |||
| Missing | 107 (18%) | 99% | 57.75 | Trimmed Mean (10%) | 33.80 | 25 | 3 (<1%) | |||
| Distinct | 449 (77%) | 95% | 51.30 | Mode | 0 | 30 | 3 (<1%) | |||
| Non-Duplicate | 429 (74%) | 75% | 42.87 | Range | 141.97 | 36.43 | 2 (<1%) | |||
| Duplicates | 133 (23%) | 50% | 36.16 | IQR | 18.59 | 34.57 | 2 (<1%) | |||
| Dup. Values | 20 (3%) | 25% | 24.27 | Std | 17.46 | 40 | 2 (<1%) | |||
| Zeros | 7 (1%) | 5% | -2.59 | MAD | 12.81 | 45.07 | 2 (<1%) | |||
| Negative | 28 (5%) | 1% | -27.43 | Kurt | 3.84 | 37.08 | 2 (<1%) | |||
| Memory Usage | <1 Mb | Min | -71 | Skew | -1.56 | 32.46 | 2 (<1%) | |||
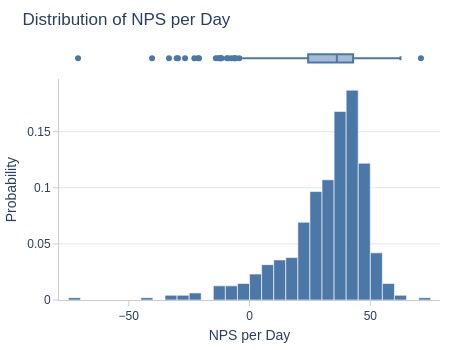
Key Observations:
Only ~5% of days had good NPS (>50)
5% had negative NPS
Indicates customer dissatisfaction spikes
Comment Title#
Let’s look at the word cloud from review titles.
df_reviews.viz.wordcloud('review_comment_title')

Key Observations:
Most review titles use positive language
Let’s look at the top words by frequency.
fig = df_reviews.analysis.word_frequency(
    'review_comment_title'
    , text_auto=True
    , title='Top 10 Most Frequent Words in Review Title'
)
pb.to_slide(fig)
fig.show()
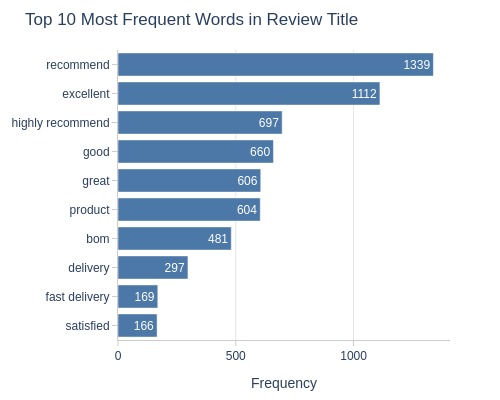
Key Observations:
Most common title words: “recomend”, “excellent”
Let’s analyze the sentiment of the text.
df_reviews.analysis.sentiment('review_comment_title')
Key Observations:
~10% of titles are negative
Sentiment IQR above 0 (neutral/positive bias)
Comment Message#
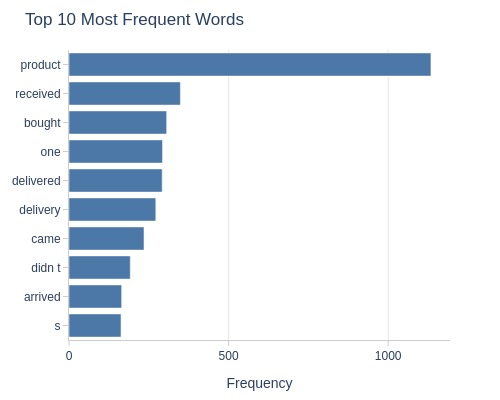
Let’s look at the word cloud and the top words by frequency from the review messages.
df_reviews.viz.wordcloud('review_comment_message')
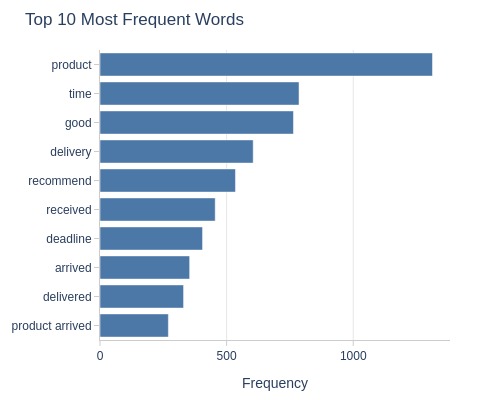
fig = df_reviews.analysis.word_frequency(
'review_comment_message'
, text_auto=True
, title='Top 10 Most Frequent Words in Review Message'
)
pb.to_slide(fig)
fig.show()

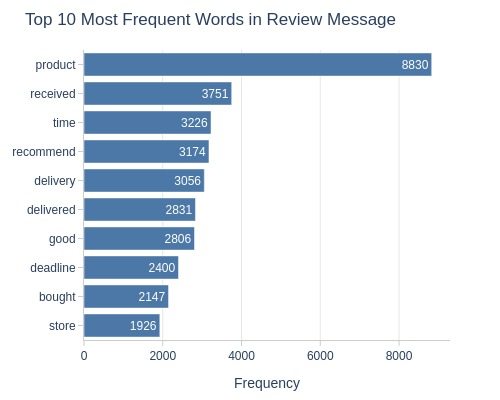
Key Observations:
Many words relate to delivery
Most common review word: “product”
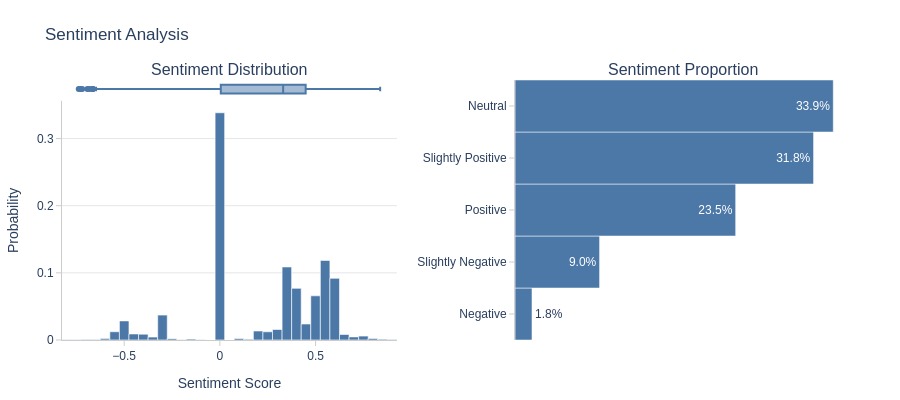
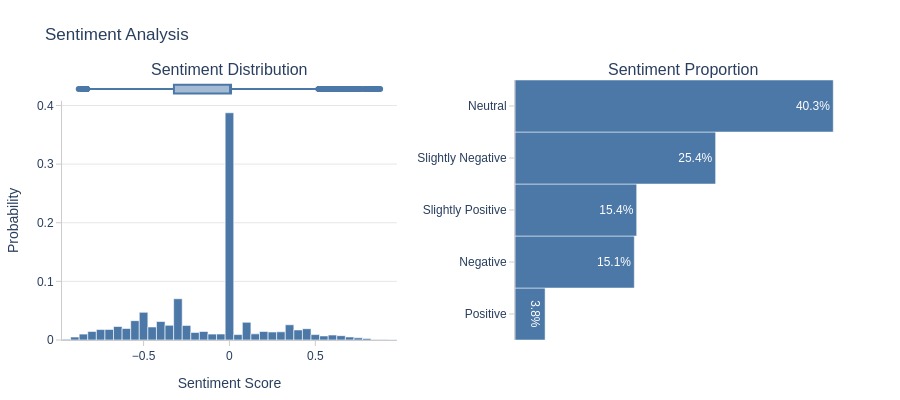
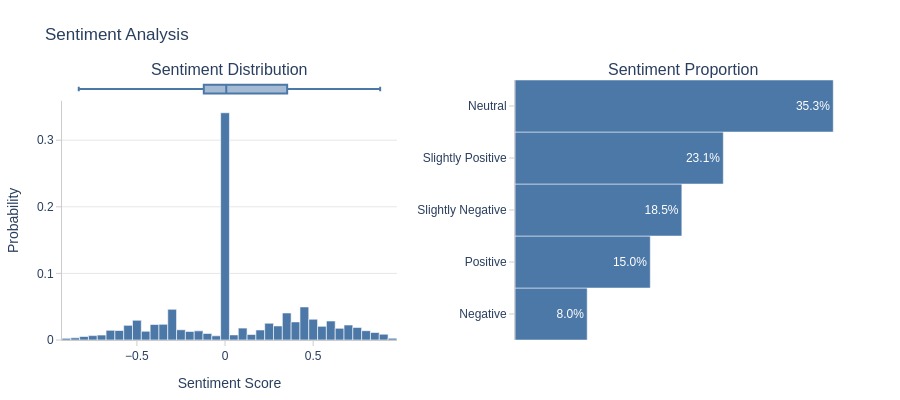
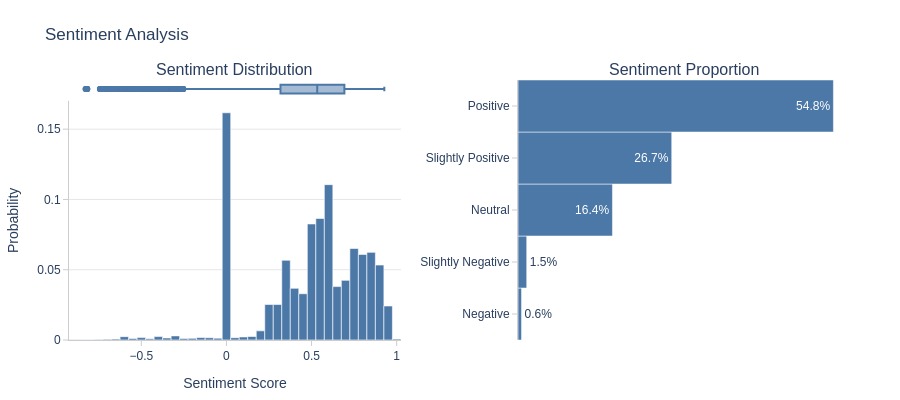
Let’s analyze the sentiment of the text.
df_reviews.analysis.sentiment('review_comment_message')
Key Observations:
~15% of messages are negative
Overall sentiment leans positive
Impact of Rating on Review Text#
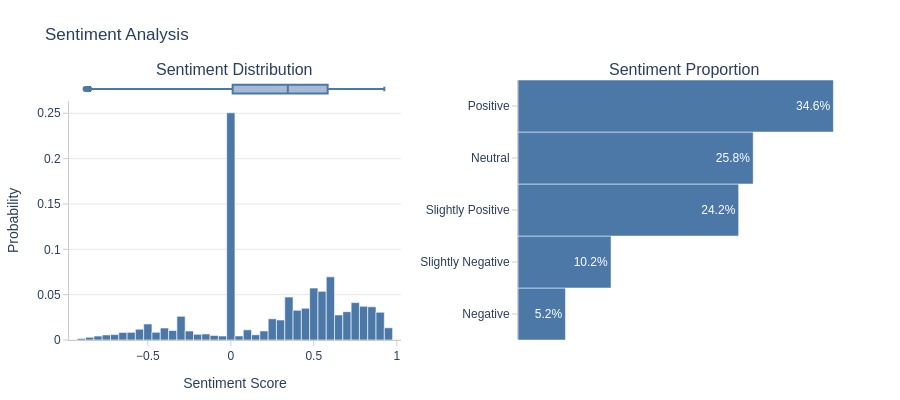
Score 1
Let’s look at the word cloud, top 20 words by frequency, and the emotional tone of the text for a rating of 1.
df_reviews[lambda x: x.review_score==1].viz.wordcloud('review_comment_message')
df_reviews[lambda x: x.review_score==1].analysis.word_frequency('review_comment_message').show()
df_reviews[lambda x: x.review_score==1].analysis.sentiment('review_comment_message')

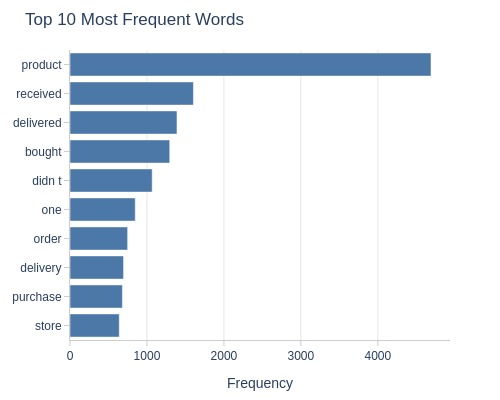
Key Observations:
1-star reviews:
Contain negative words
Clearly negative sentiment (IQR <0)
Score 2
Let’s look at the word cloud, top 20 words by frequency, and the emotional tone of the text for a rating of 2.
df_reviews[lambda x: x.review_score==2].viz.wordcloud('review_comment_message')
df_reviews[lambda x: x.review_score==2].analysis.word_frequency('review_comment_message').show()
df_reviews[lambda x: x.review_score==2].analysis.sentiment('review_comment_message')

Key Observations:
2-star reviews:
Contain negative words
Mostly negative sentiment
Score 3
Let’s look at the word cloud, top 20 words by frequency, and the emotional tone of the text for a rating of 3.
df_reviews[lambda x: x.review_score==3].viz.wordcloud('review_comment_message')
df_reviews[lambda x: x.review_score==3].analysis.word_frequency('review_comment_message').show()
df_reviews[lambda x: x.review_score==3].analysis.sentiment('review_comment_message')

Key Observations:
3-star reviews:
Fewer negative words
Leans positive overall
Score 4
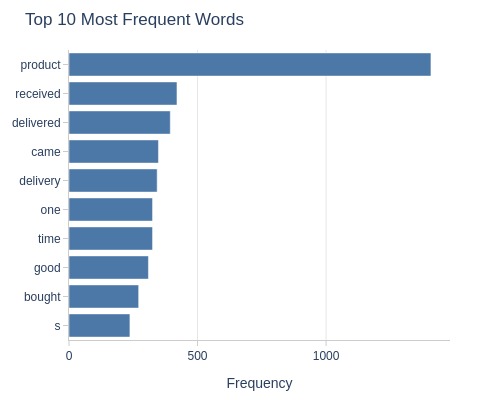
Let’s look at the word cloud, top 20 words by frequency, and the emotional tone of the text for a rating of 4.
df_reviews[lambda x: x.review_score==4].viz.wordcloud('review_comment_message')
df_reviews[lambda x: x.review_score==4].analysis.word_frequency('review_comment_message').show()
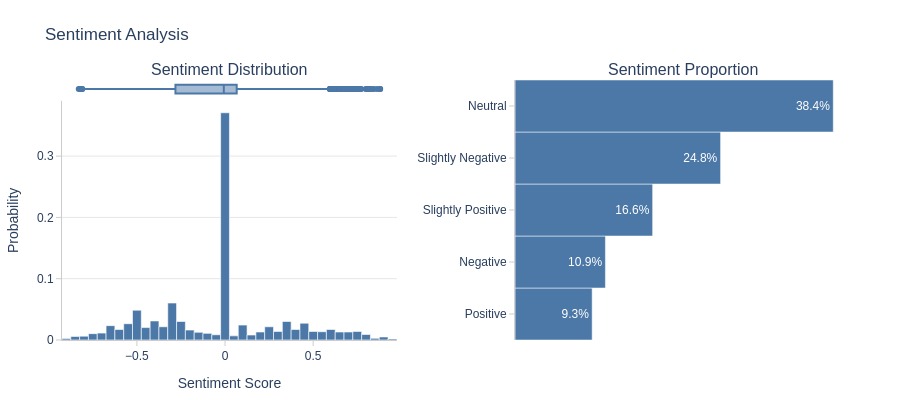
df_reviews[lambda x: x.review_score==4].analysis.sentiment('review_comment_message')

Key Observations:
4-star reviews:
Many positive words
Clearly positive sentiment
Score 5
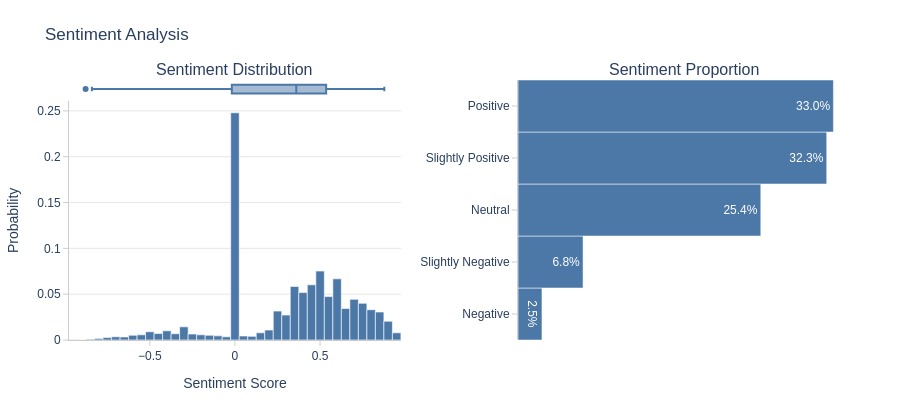
Let’s look at the word cloud, top 20 words by frequency, and the emotional tone of the text for a rating of 5.
df_reviews[lambda x: x.review_score==5].viz.wordcloud('review_comment_message')
df_reviews[lambda x: x.review_score==5].analysis.word_frequency('review_comment_message').show()
df_reviews[lambda x: x.review_score==5].analysis.sentiment('review_comment_message')

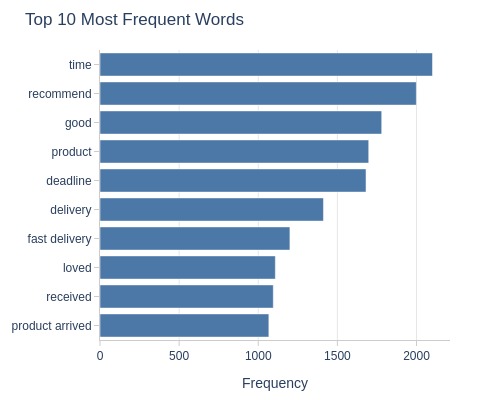
Key Observations:
5-star reviews:
Dominated by positive words
Strongly positive sentiment
Comment Message Lenght#
Let’s see at statistics and distribution of the metric.
Key Observations:
75% of reviews have messages ≤100 characters
Let’s look by different dimensions.
By Review Score
Key Observations:
Lower ratings correlate with longer messages
Negative reviews tend to be more detailed